


When to go long on GBP/USD:
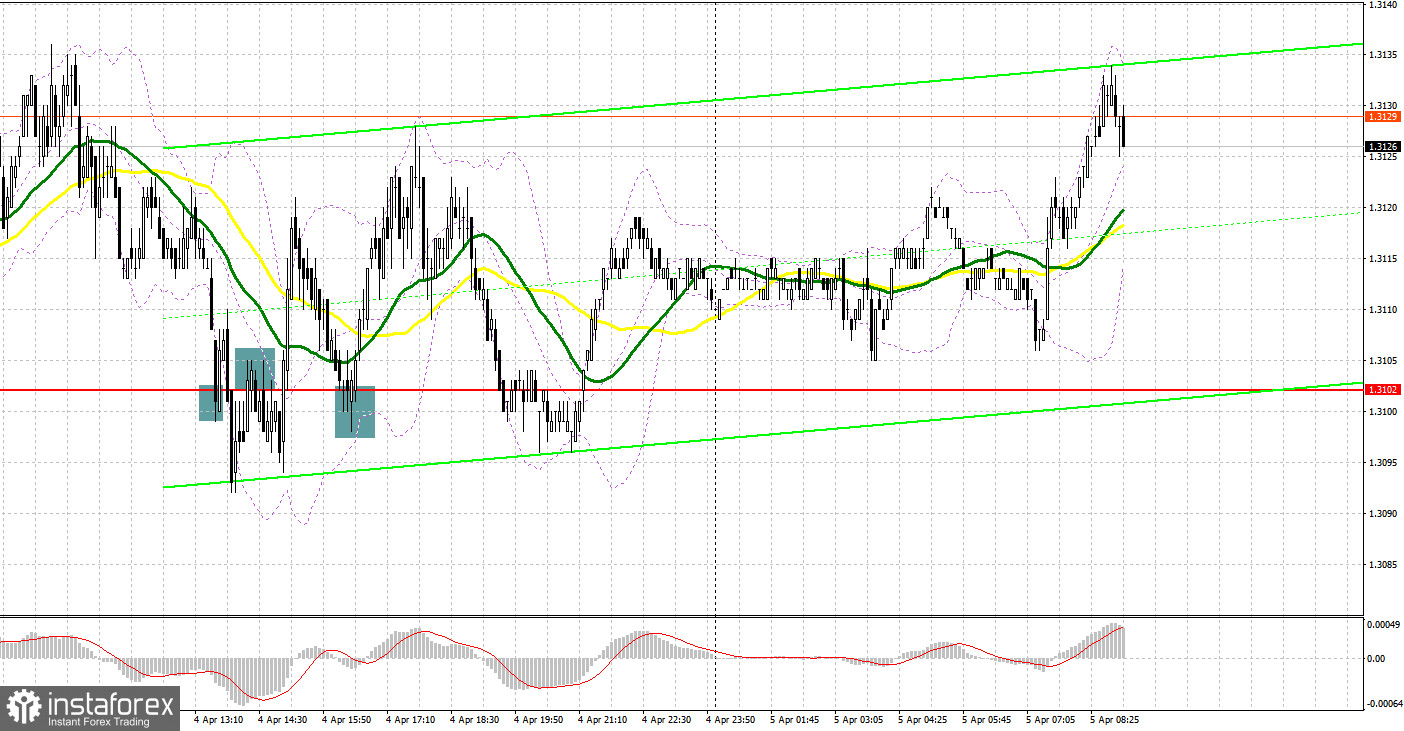
A series of signals was made during the North American session yesterday. Let's turn to the 5-minute chart and try to figure out what actually happened. In my previous overview, I paid attention to several levels, but the pair failed to approach them. The lack of fundamentals, as well as Governor Bailey's statement, had no effect on the pair whatsoever. Amid the general negative background, the pound fell to support at 1.3102. During the North American session, bulls and bears tried to take control of the level. Bulls managed to protect support, and a false breakout producing a buy signal occurred. Nevertheless, the pair did not show any growth. In a while, bears broke through 1.3102 and retested the level bottom-top. Eventually, longs were closed and shorts were opened. However, the pound did not fall, and traders incurred losses. By the middle of the North American session, a false breakout at 1.3102 made a buy signal, which resulted in a 30 pips rise, allowing market players to recoup losses and even make some profit.
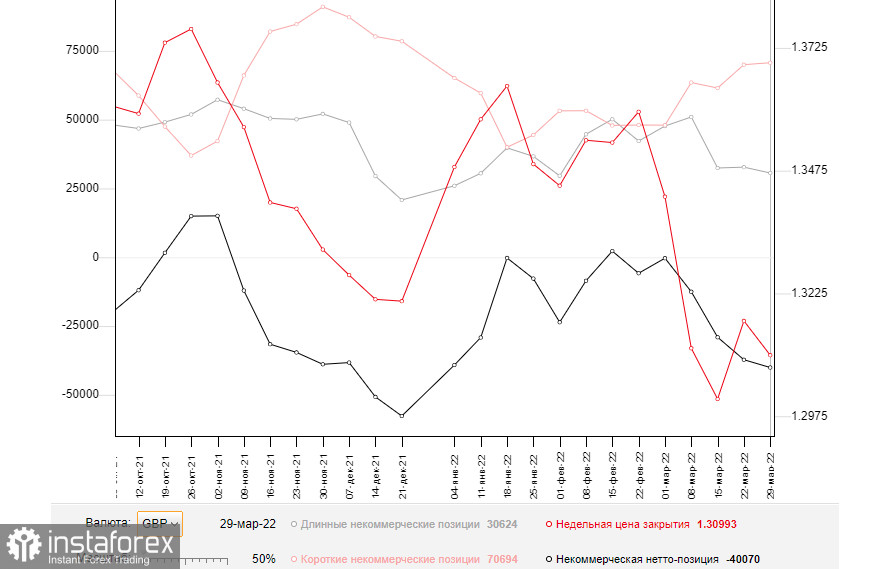
Before we analyze the technical picture of GBP/USD, let's take a look at the futures market. The Commitments of Traders report for March 29 logged a rise in short positions and a decrease in long ones. The results reflect market concerns over the current state of the British economy and persistent inflation, which could make things worse for households in the UK. Experts say the situation could aggravate because inflationary risks weighing on the British economy are now difficult to evaluate. In this light, the dovish stance of Governor Bailey, which allows bulls to increase the volume of longs in the face of further rate hikes, seems to be inappropriate. The only driver GBP bulls can rely on is progress in Russia-Ukraine peace talks. Above all else, aggressive measures of the US Fed ensure high demand for the dollar in the face of growing recession risks in the second half of the year. According to the COT report from March 29, long non-commercial positions fell to 30,624 from 32,753. Short non-commercial positions jumped to 70,694 from 69,997. As a result, the negative value of non-commercial net positions grew to -40,070 from -37,244. The weekly closing price dropped to 1.3099 versus 1.3169.
The fact that bulls have nothing to offer to the market right now only aggravates their position. If they don't make any moves in the coming days, pressure on the pound will mount. Today, we will see the release of business activity data in the UK. A breakout at 1.3143 will occur if the services and composite PMIs turn out to be strong. Bulls will also try to protect support at 1.3108, in line with bullish MAs. A false breakout there along with the release of strong PMI results in the services sector would give a buy signal, allowing the GBP/USD pair to get back to resistance at 1.3143. However, given the current state of the pound, bearish activity is likely to increase every time the pound shows significant growth. Fed Chairman Powell and his new monetary policy rhetoric are the reason for a rise in the volume of shorts. However, a breakout and a test of the 1.3143 level bottom-top would make an additional buy entry point, boosting demand for the pound and pushing the quote to the 1.3180 high, in line with the upper boundary of the wider sideways channel. The pound has traded in this channel since March 29. The level of 1.3219 stands as a more distant target where you should consider profit taking. The price would hit this target if tensions between Russia and Ukraine eased. In case of bearish GBP/USD during the European session and a decrease in bullish activity at 1.3108, you may look for buy entry points from 1.3071. In case of a false breakout there, the downtrend would stop, and an entry point would be created, in the view of a possible short-term upward correction. Long positions on GBP/USD could also be entered on a bounce off 1.3038, allowing a 30-35 pips correction intraday.
When to go short on GBP/USD:
Bears feel relatively calm today. Bearish bias is fuelled by the aggravating geopolitical situation. However, if tensions were to ease, bears would quickly leave the market, which, in turn, would lead to a stronger pound. The pair trades slightly above the MAs, reflecting a possible attempt of bulls to gain control over the market. Bears will try to protect the 1.3143 level. In case of a false breakout there along with the release of disappointing business activity results, a sell entry point would form with the target at 1.3108. Bulls and bears would both try to establish control over this mark, which is in line with the MAs and a row of stop orders set by bulls. After a breakout and a retest of the 1.3108 target, GBP/USD would head towards the 1.3071 and 1.3038 lows. In the event of bullish GBP/USD during the European session and a decrease in bearish activity at 1.3143, you may look for sell entry points after the price has reached 1.3180 and a false breakout has occurred. Short positions on GBP/USD could also be entered on a bounce off the 1.3219 high, allowing a 30-35 pips downward correction intraday.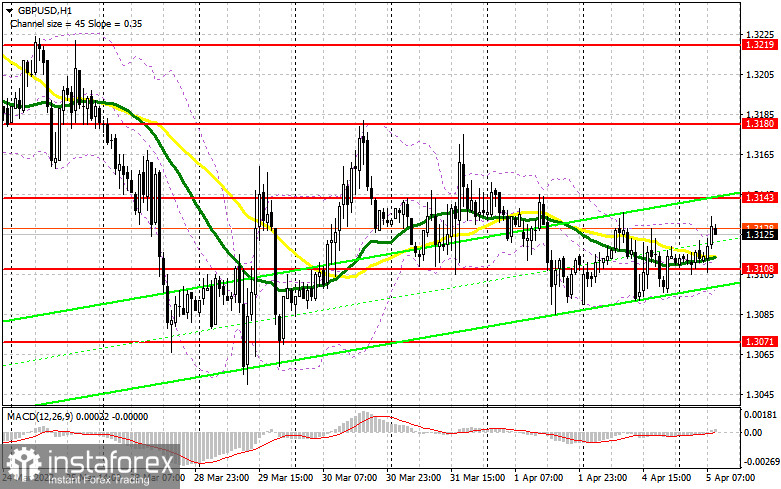
Indicator signals:
Moving averages
Trading is carried out above the 30-day and 50-day moving averages, indicating a bullish activity.
Note: The period and prices of moving averages are viewed by the author on the hourly chart and differ from the general definition of classic daily moving averages on the daily chart.
Bollinger Bands
The lower band at 1.3100 stands as support. Resistance is seen at 1.3140 in line with the upper band.
Indicator description:
- Moving average (MA) determines the current trend by smoothing volatility and noise. Period 50. Colored yellow on the chart.
- Moving average (MA) determines the current trend by smoothing volatility and noise. Period 30. Colored green on the chart.
- Moving Average Convergence/Divergence (MACD). Fast EMA 12. Slow EMA 26. SMA 9.
- Bollinger Bands. Period 20
- Non-commercial traders are speculators such as individual traders, hedge funds, and large institutions who use the futures market for speculative purposes and meet certain requirements.
- Long non-commercial positions are the total long position of non-commercial traders.
- Non-commercial short positions are the total short position of non-commercial traders.
- Total non-commercial net position is the difference between short and long positions of non-commercial traders.


