


In my morning forecast, I paid attention to the level of 1.3143 and recommended making decisions on entering the market. Let's look at the 5-minute chart and figure out what happened. The growth in the first half of the day after the release of good data on the PMI index of the services sector in the UK did not allow buyers to catch on to 1.3143, and a false breakdown at this level gave a sell signal, which led to the pound moving down by more than 30 points. Unfortunately, I did not see the test of the middle of the 1.3108 side channel. From a technical point of view, nothing has changed for the second half of the day, nor has the strategy changed. And what were the entry points for the euro this morning?

To open long positions on GBP/USD, you need:
A sharp jump in activity in the service sector in March this year indicates the good condition of the sector, which has fully revived after the coronavirus pandemic. However, its further prospects in conditions of high inflation are far from clear and how strong the impact of high prices will be is anyone's guess. The further upward dynamics of the pound are clearly in great doubt and very good geopolitical news is needed for the pair to be able to get out of the side channel in which it has been since March 28 this year. In the afternoon, reports on the index of business activity in the services sector from the US ISM and the foreign trade balance are released. Good indicators can return pressure on the British pound, which will lead to a decrease in the pair to the area of 1.3108. The formation of a false breakdown at this level will lead to the formation of the first buy signal that can return GBP/USD to the area of 1.3143. The test of this area from top to bottom forms an additional entry point for opening long positions, which will strengthen the bulls and open up the prospect of growth in the area of the upper limit of 1.3180, where I recommend fixing the profits. The 1.3219 area will be a more distant target, but it will be quite difficult to get to this level in the current conditions. Under the scenario of the GBP/USD falling during the US session and the lack of activity at 1.3108, and most likely it will be, it is best to postpone purchases to a larger level of 1.3071. I advise you to enter the market there only if there is a false breakdown. You can buy GBP/USD immediately on a rebound from 1.3038, or even lower - in the area of 1.3003 and only with the aim of correction of 30-35 points within a day.
To open short positions on GBP/USD, you need:
Bears today proved their presence in the area of 1.3143, but it never came to a major sale. Until the moment when trading is conducted below this range, we can expect a decline in the pound to the support area of 1.3108 and a further fall of the pair according to the trend formed on March 23. The more the pair is in the side channel, the higher the chances of its decline. At the moment, trading is conducted above the moving averages, which indicates an attempt by the bulls to seize the initiative, however, as we see on the chart, there are very few people willing to buy around 1.3143. The primary task of sellers remains to protect this range. The formation of a false breakout at this level will give an entry point into short positions. But, as I noted above, the more important target will be the 1.3108 area. Going beyond this range and a reverse test from below will lead to the demolition of several buyers' stop orders, which will bring GBP/USD to the lows: 1.3071 and 1.3038. The further target will be the 1.3003 area, where I recommend fixing the profits. If the pair grows during the US session after weak US data and weak sellers' activity at 1.3143, it is best to postpone sales to 1.3173. I also advise you to open short positions there only in case of a false breakdown. You can sell GBP/USD immediately for a rebound from the maximum of 1.3180, or even higher - from 1.3219, counting on the pair's rebound down by 30-35 points within a day.
The COT reports (Commitment of Traders) for March 29 recorded an increase in short positions and a reduction in long ones. This all points to concerns related to the state of the UK economy and the risks of high inflation, which is sure to further exacerbate the ongoing crisis of British households. Experts note that the situation will only worsen, as inflation risks, which mainly negatively affect the economy, are now quite difficult to assess. Against this background, the softer position of the governor of the Bank of England seems inappropriate, which does not allow buyers of risky assets to engage in a set of long positions on the pound in the expectation of a further increase in interest rates. The only thing the bulls can count on now is the positive results of the negotiations between the representatives of Russia and Ukraine and progress towards a settlement of the conflict. Do not forget about the aggressive policy of the Federal Reserve System, which continues to maintain demand for the US dollar due to the increased significant risks of economic recession in the second half of the year. The COT report for March 29 indicated that long non-commercial positions dropped from the level of 32,753 to the level of 30,624, while short non-commercial positions jumped from the level of 69,997 to the level of 70,694. This led to an increase in the negative value of the non-commercial net position from -37,244 to -40,070. The weekly closing price decreased to 1.3099 against 1.3169.
Signals of indicators:
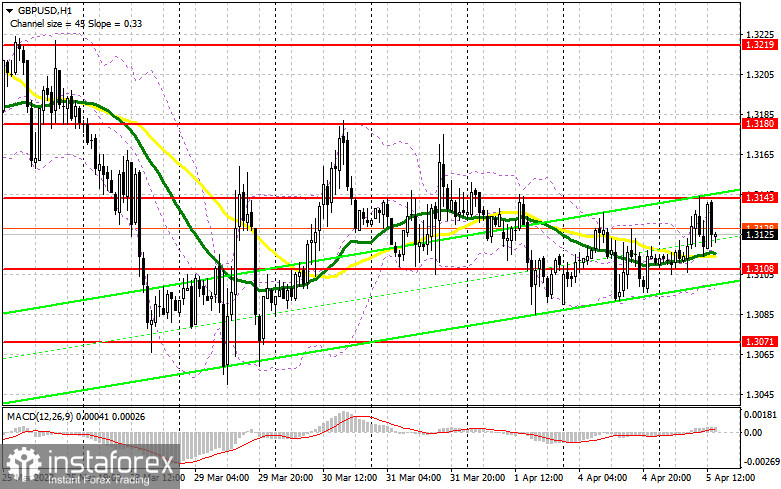
Moving Averages
Trading is conducted around 30 and 50 daily moving averages, which indicates more of the lateral nature of the market so far.
Note: The period and prices of moving averages are considered by the author on the hourly chart H1 and differ from the general definition of the classic daily moving averages on the daily chart D1.
Bollinger Bands
In case of a decline, the lower limit of the indicator around 1.3090 will act as support.
Description of indicators
- Moving average (moving average determines the current trend by smoothing out volatility and noise). Period 50. The graph is marked in yellow.
- Moving average (moving average determines the current trend by smoothing out volatility and noise). Period 30. The graph is marked in green.
- MACD indicator (Moving Average Convergence / Divergence - moving average convergence/divergence) Fast EMA period 12. Slow EMA period 26. SMA period 9
- Bollinger Bands (Bollinger Bands). Period 20
- Non-profit speculative traders, such as individual traders, hedge funds, and large institutions use the futures market for speculative purposes and to meet certain requirements.
- Long non-commercial positions represent the total long open position of non-commercial traders.
- Short non-commercial positions represent the total short open position of non-commercial traders.
- Total non-commercial net position is the difference between the short and long positions of non-commercial traders.


