


Analyzing trades on Tuesday:
GBP/USD on 30M chart
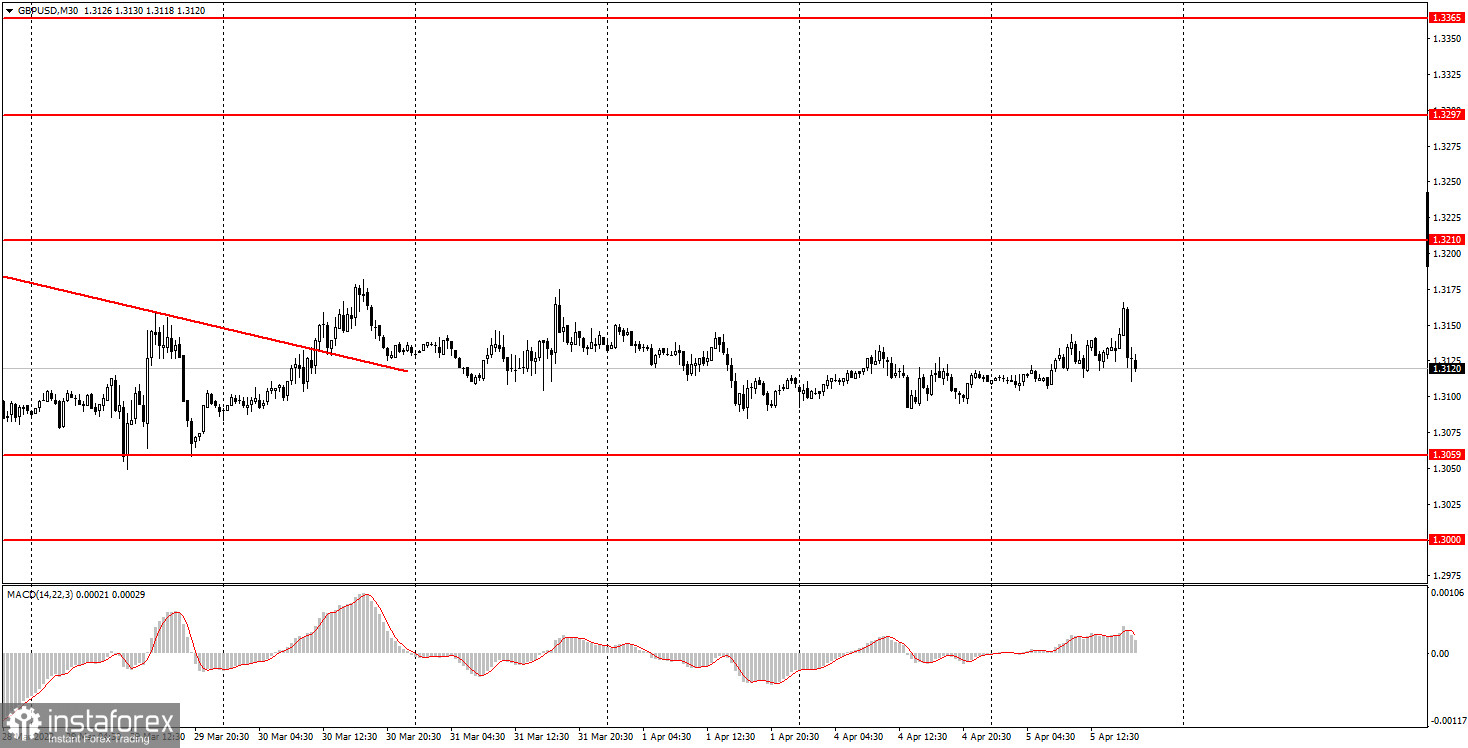
On Tuesday, the trajectory of GBP/USD was rather uncertain and mixed. Actually, there is no trend at the moment as the pair is not even in a sideways channel. This comes fully in line with our forecast as the pair was moving up for two days and then was trading down for three days, then up again. On Tuesday afternoon, the pair managed to gain 50 pips before falling again. Therefore, the US dollar did not benefit much from this decline. The macroeconomic background had also no effect on the market. Business activity indices in the UK turned out to be slightly better than expected, but this data was not so important. The ISM business activity index in the US came in better than in February and could have possibly supported the greenback. By the way, USD started to rise at the moment when this report was published. Yet, it is unlikely that a 1.8-point rise in the business activity index could have pushed the dollar up by 50 pips. Notably, on Friday, the market showed no reaction to such key reports as the unemployment rate and nonfarm payrolls in the US.
GBP/USD on 5M chart
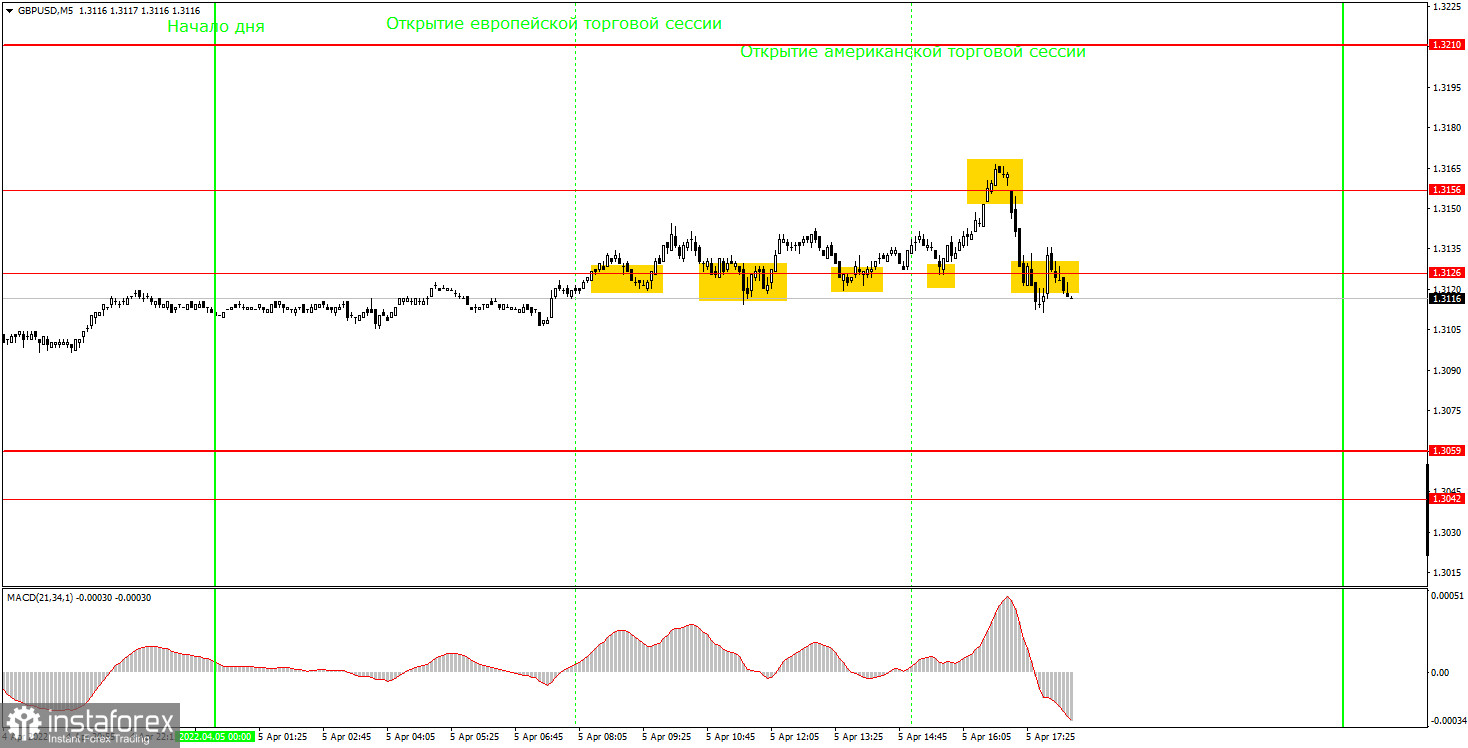
On the 5-minute time frame, the movement of the pair was far from perfect. Although there was no clear flat movement on the chart, the pair spent most of the day hovering between 1.3126 and 1.3156 that is, in a 30-pip sideways channel. Therefore, most of the trading signals turned out to be false. Let's discuss them. The first buy signal was formed near the level of 1.3126, but the price failed to move by even 15 pips. The next two buy signals were the same. Only the fourth signal allowed the pair to rise to the level of 1.3156, from where the quote made a slight rebound. It was already clear in the European session that the pair would trade in a sideways manner. So, we could have stopped trading after the first two signals. One buy trade could have been opened after these signals. But it generated zero profit as the pair never really consolidated below the level of 1.3126, which would have been a sell signal. There was only one signal at 1.3156 that could have been used, as a more or less strong movement had started by that time. Yet, even in this case, we couldn't get much profit as the price started a swing movement near the level of 1.3126, and novice traders could close the trade at that point. Therefore, the maximum profit on Tuesday could be around 10-15 pips.
Trading tips on Wednesday:
On the 30-minute time frame, the downtrend has been canceled, and there is no new trend at the moment. The British pound is slowly falling towards the level of 1.3059, but it can take weeks to reach it. At this time, traders are clearly waiting for new drivers although there is not much to expect this week. On the 5-minute chart on Wednesday, it is recommended to trade at the levels of 1.3000, 1.3042, 1.3059, 1.3126, 1.3156, and 1.3210. Place a Stop Loss to breakeven as soon as the price passes 20 pips in the right direction. On Wednesday, the UK will publish the business activity index in the construction sector which is of minor importance to the market. In the US, the Fed minutes from the last meeting will be released. However, by the time of the publication, which will be very late, traders need to close their position.
Basic rules of the trading system
1) The strength of the signal is determined by the time it took the signal to form (a rebound or a breakout of the level). The quicker it is formed, the stronger the signal is.
2) If two or more positions were opened near a certain level based on a false signal (which did not trigger a Take Profit or test the nearest target level), then all subsequent signals at this level should be ignored.
3) When trading flat, a pair can form multiple false signals or not form them at all. In any case, it is better to stop trading at the first sign of a flat movement.
4) Trades should be opened in the period between the start of the European session and the middle of the US trading hours, when all positions must be closed manually.
5) You can trade using signals from the MACD indicator on the 30-minute time frame only amid strong volatility and a clear trend that should be confirmed by a trendline or a trend channel.
6) If two levels are located too close to each other (from 5 to 15 pips), they should be considered support and resistance levels.
On the chart
Support and Resistance Levels are the levels that serve as targets when buying or selling the pair. You can place Take Profit near these levels.
Red lines are channels or trend lines that display the current trend and show in which direction it is better to trade now.
The MACD indicator (14, 22, and 3) consists of a histogram and a signal line. When they cross, this is a signal to enter the market. It is recommended to use this indicator in combination with trend patterns (channels and trendlines).
Important announcements and economic reports that can be found on the economic calendar can seriously influence the trajectory of a currency pair. Therefore, at the time of their release, we recommend trading as carefully as possible or exiting the market in order to avoid sharp price fluctuations.
Beginners on Forex should remember that not every single trade has to be profitable. The development of a clear strategy and money management is the key to success in trading over a long period of time.


