


Yesterday, GBP/USD created a few good sell signals. Now let's take a look at the 5-minute chart and figure out market entry points. In my morning article, I turned your attention to 1.3143 and recommended making decisions on market entry with this level in focus. The currency pair grew in the first half of the day following the upbeat UK services PMI. However, the buyers failed to conquer 1.3143. A false breakout of this level generated a sell signal, thus pushing GBP/USD 30 pips down. Unfortunately, I didn't see any test of 1.3108, the middle line of the sideways channel. In the second half of the day, the bulls again tried to climb above 1.3143, but no success. GBP again came under pressure due to fresh US macroeconomic data released in the New York session. A breakout and an opposite test of 1.3108 gave a sell signal. As a result, the currency pair dropped more than 40 pips.

What is needed to open long positions on GBP/USD
As I said above, strong US PMIs boosted demand for the US dollar. Under the escalating geopolitical tensions, investors are again seeking shelter in safe haven assets. Traders are reluctant to buy GBP even at current lows because of serious problems of British households and futile struggle of the Bank of England against high inflation.
Investors lack optimism due to another sell-offs of GBP/USD and the risks of a breakout of the lower border of the sideways channel. Today the economic calendar for the UK is empty. So, GBP buyers cannot find an excuse to enter the market in the first half of the day. The major task in the European session is to defend support at 1.3059. Only a false breakout at this level will generate the first buy signal that will enable GBP/USD to rebound to 1.3093, where moving averages are passing, playing in favor of the sellers.
1.3059 is the faint hope for the bulls because the level serves as the lower border of the sideways channel where the pair has been trapped since March 28. If this scenario is implemented, a breakout and a test of 1.3093 downwards will provide an extra point for entering the market with long positions. This will encourage the bulls and open the door towards higher levels of around 1.3129. A more distant target is seen at 1.3163 where I recommend profit taking. However, it would be difficult to reach that level under current market conditions. Only good news on the geopolitics will contribute to growth of GBP/USD to the upper border of the sideways channel. If GBP/USD falls in the European session and trades sluggishly at 1.3059, it would be better to cancel long positions until a lower low at 1.3030. I would advise you to enter the market there during a false breakout. We could buy GBP/USD immediately at a drop to 1.3001 or lower from 1.2960, bearing in mind a 30-35-pips correction intraday.
What is needed to open short positions on GBP/USD
The bears are about to resume the downtrend. Yesterday, the defense of the upper border of the sideways channel and a large sell-off in the second half of the day proved that big market players are betting against GBP. The main task for the bears is to protect interim resistance at 1.3093 where moving averages are passing. A fake breakout and at this level will signal a market entry point for short positions. In this case, the downtrend will intensify and the price will decline to 1.3059. The bears should fight for this level. If the price falls below, it will activate stop orders of the buyers. A breakout and the opposite test of 1.3059 will generate a sell signal, thus pushing GBP/USD to the lows at 1.3030 and 1.3001. A lower target is defined at 1.2960 where I recommend profit taking.
In case GBP/USD grows during the European session and the sellers are weak at 1.3039, it will not cancel the bearish scenario, though it would be better to delay selling until 1.3129. We'd rather open short positions there on condition of a false breakout. We can sell GBP/USD immediately at a bounce off the high at 1.3163 or from a higher level at 1.3193, bearing in mind a 30-25-pips correction intraday.

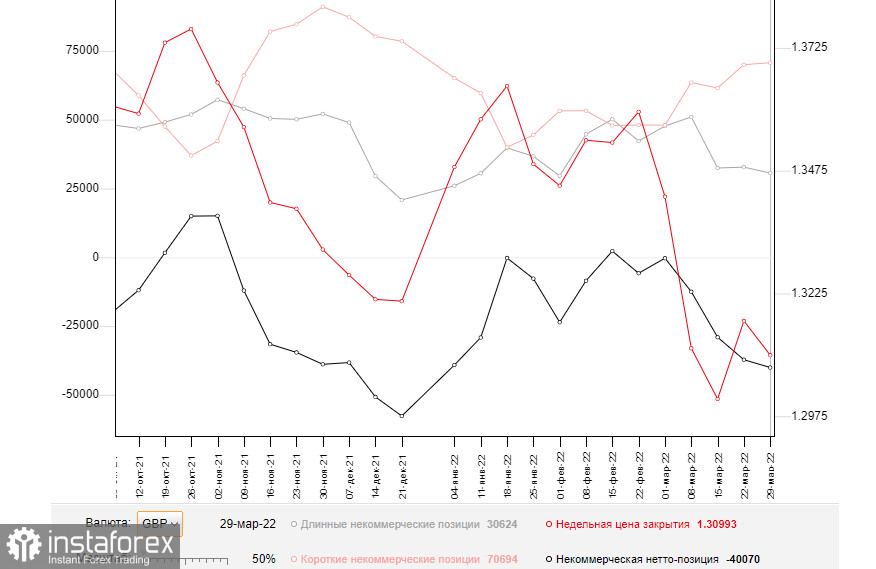
The COT report from Marc 29 logs an increase in short positions and contraction in long ones. This indicates concerns about ailing economic conditions in the UK and risks of higher inflation. These factors are likely to exert heavier pressure on British households. Experts say that the economic conditions in the Kingdom will get worse. For the time being, analysts find it hard to assess inflationary risks that are putting strain on the domestic economy. In this context, markets are disappointed with the softer stance of the Bank of England Governor. This won't allow buyers of risky assets to add long positions on the pound sterling because they cannot rely on further rate hikes. The only thing to cheer up the bulls is some positive outcome in the peace talks between Russia and Ukraine and steps towards peaceful solutions. At the same time, we should forget about the hawkish monetary policy of the Federal Reserve that sustains strong demand for the US dollar in the face of mounting risks of a recession in the second half of the year.
The COT report from March 29 reads that long non-commercial positions declined from 32,753 to 30,624 whereas short non-commercial positions increased from 69,997 to 70,694. As a result, the negative value of non-commercial net positions went up to -37,244 from -40,070. GBP/USD closed lower at 1.3099 against the closing price of 1.3169 a week ago.
Indicators' signals:
The currency pair is trading slightly below the 30 and 50 daily moving averages. It indicates a further decline of GBP/USD.
Moving averages
Note: The period and prices of moving averages are considered by the author on the H1 hourly chart and differs from the general definition of the classic daily moving averages on the daily D1 chart.
Bollinger Bands
If GBP/USD grows, the indicator's upper border at 1.3140 will serve as resistance. Otherwise, if the currency pair falls, the lower border at nearly 1.3030 will serve as support.
Description of indicators
- Moving average (moving average, determines the current trend by smoothing out volatility and noise). Period 50. It is marked yellow on the chart.
- Moving average (moving average, determines the current trend by smoothing out volatility and noise). Period 30. It is marked green on the chart.
- MACD indicator (Moving Average Convergence/Divergence — convergence/divergence of moving averages) Quick EMA period 12. Slow EMA period to 26. SMA period 9
- Bollinger Bands (Bollinger Bands). Period 20
- Non-commercial speculative traders, such as individual traders, hedge funds, and large institutions that use the futures market for speculative purposes and meet certain requirements.
- Long non-commercial positions represent the total long open position of non-commercial traders.
- Short non-commercial positions represent the total short open position of non-commercial traders.
- Total non-commercial net position is the difference between short and long positions of non-commercial traders.


