


In today's article on the pound/dollar currency pair, the main focus will be on the technical analysis of this interesting and much-loved trading instrument. Nevertheless, first, it is necessary to recall once again the important events of today. It is one thing - it is the publication of the minutes of the March meeting of the Open Market Committee (FOMC) of the US Federal Reserve. The event is very significant and expected by market participants, as it should further convince investors of the clear "hawkish" attitude of the American Central Bank. This attitude is already embedded in the price of the US dollar, therefore, in the case of insufficiently strict content of the protocols, the US dollar can have serious problems. Let me remind you that the publication of the FOMC protocols is scheduled for 19:00 London time. Before that, some activity in the trading of the GBP/USD currency pair may be brought by data from the UK on the index of business activity in the construction sector, which will be released at 09:30 (London time). And yet, the March FOMC protocols, without any doubt, will be the main event not only today but also the entire trading week as a whole. It is also worth noting that this week is very full of speeches by members of the Fed's Open Market Committee. Surely the rhetoric of their speeches will also be taken into account by the bidders. And we turn to the consideration of the price charts of the GBP/USD pair.
Daily
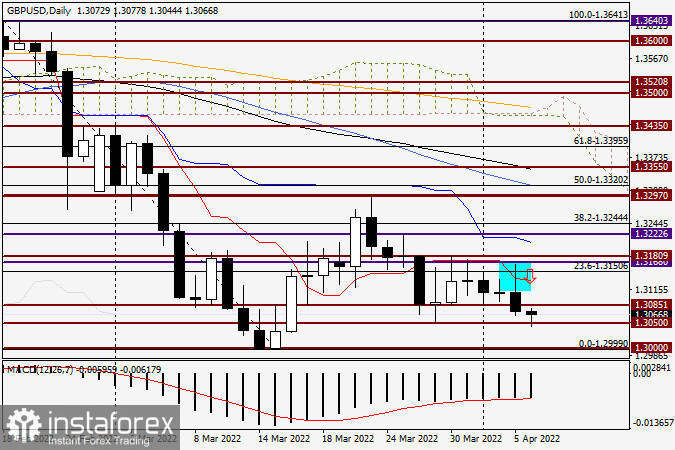
As can be seen on the daily chart, yesterday the bulls for the pound tried to pass the red line of the Tenkan Ichimoku indicator once again, as well as an important and very strong resistance zone of 1.3168-1.3180. Looking at the daily timeframe, we can see what came out of it in the end. And zilch came out. Following the results of trading on April 5, a bearish candle with a fairly long upper shadow appeared, which also demonstrates to us the strength of the Tenkan resistance and the designated resistance zone. In principle, the idea of selling a pair in an attempt to overcome this area turned out to be quite justified, only I put the arrow a little higher, but the price barely reached it. I would like to draw your attention to one very important detail. When the author gives any trading recommendations and indicates prices for opening positions, you need to try to open purchases or sales a little lower.
Yes, in this case, the stop loss will need to be increased, but the probability that a pending order will open from the designated zone, in this case, the sell limit, will become much higher. Today, at the end of this article, the pound/dollar pair is trading with a slight decline so far. We can see perfectly well that right now a significant and very strong technical and historical level of 1.3050 is being tested for strength. In my memory, this mark has repeatedly acted as strong support or resistance, that is, it had a significant impact on the price dynamics of GBP/USD. How it will be this time and whether 1.3050 will be able to contain the pressure of bears on the pound, as well as become a kind of springboard for possible growth, we will judge tomorrow, based on the results of today's trading. As noted earlier, a true breakdown of 1.3050 will inevitably lead to testing of the iconic psychological level of 1.3000. In my personal opinion, it is the 1.3050-1.3000 price zone that seems to be the key to the further direction of the quote.
H4
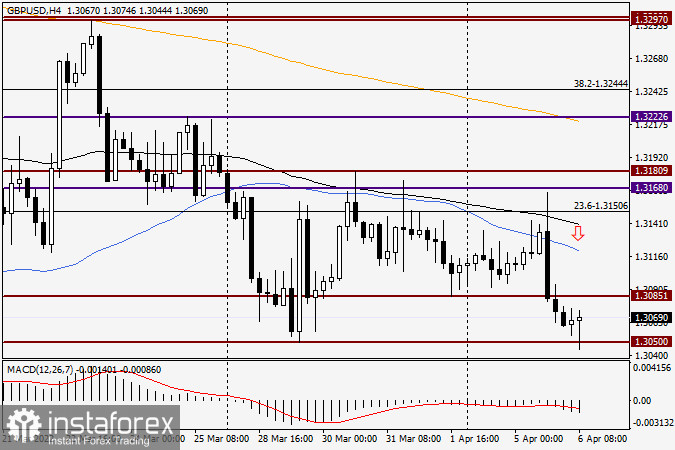
The four-hour price chart shows even better how significant the 1.3050 mark is for the bidders. At the very end of writing this article, the pair is trying to bounce up from this level, that is, a fierce struggle between the opposing sides has already begun around 1.3050, the result of which, without any doubt, will be influenced by today's publication of the Fed minutes. Now it is difficult to assess what the reaction of market participants will be to the protocols published in the evening, and it is not worth guessing. I consider 1.3050-1.3000 to be the zone for purchases. I recommend looking for sales after short-term ups in the price area of 1.3100-1.3140, where the blue 50 simple moving average and the black 89 exponential are located.


