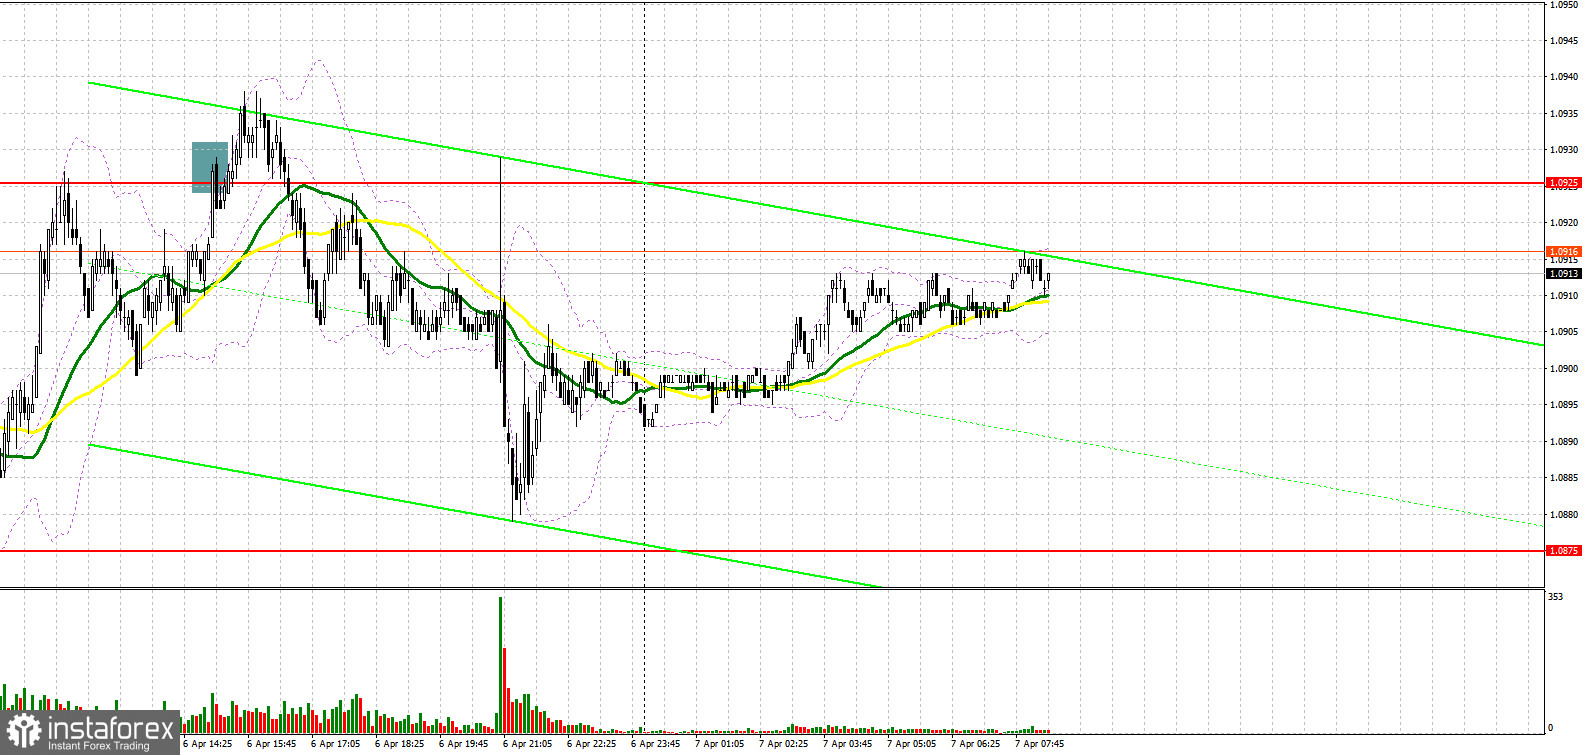
Yesterday, traders received several signals to enter the market. Let us take a look at the 5-minute chart to analyze the market situation. Earlier, I attracted your attention to the level of 1.0875 so that you could decide when to enter the market. At the beginning of the European session, the euro tumbled amid quite strong data on Germany's factory orders. However, bulls managed to form a false break. As a result, traders received a buy signal. The pair climbed by more than 50 pips, but failed to consolidate at the resistance level of 1.0915. Quite a calm market situation and an unsuccessful attempt to jump above 1.0925 provided traders with a sell signal. The pair dropped by 40 pips.

Conditions for opening long positions on EUR/USD:
The information provided by the US Fed at the recent meeting fully met market expectations. However, traders were slightly surprised by the regulator's decision to start reducing the Fed's balance in May. This fact points to a more aggressive approach to monetary policy that will continue supporting the greenback and weakening such risk assets as the euro. Today, all eyes will be turned to the eurozone retail sales data and Germany's industrial production report.However, the closest attention will be paid to the ECB monetary policy meeting minutes. In the best-case scenario, traders may open long positions after a decline to the nearest support level of 1.0875. Since the ECB's stance is becoming more aggressive, bulls may focus on 1.0925. If the pair continue falling amid weak data, only a false break of 1.0875 will give the first buy signal. However, bulls should be active near 1.0925 to slacken the bearish movement. A downward break of this level will give an additional buy signal, thus allowing the pair to recover to 1.0970. If the price goes above 1.0970, it will have every chance to reach the highs of 1.1007 and 1.1041.If the pair falls deeper and bulls fail to protect 1.0875, it will be better to avoid opening long positions. It will be possible to go long after a false break of the low of 1.0843. Traders can also open long positions from 1.0810 or lower – from 1.0772, expecting a rise of 30-35 pips.
Conditions for opening short positions on EUR/USD:
Yesterday, bears managed to protect the level of 1.0925. However, judging by the chart, today, the pair may break this level. The bearish movement needs a pause that may cause either stagnation or an upward correction, which could turn into a fully-fledged bullish trend. Today, sellers should protect the resistance level of 1.0925. Only a false break of this level may put the euro under pressure again, thus giving a sell signal with the target at the strong support level of 1.0875. Yesterday, the price tested this level several times, but failed to drop below it. To keep the bearish trend, the pair should hit new local lows every day. In fact, it is not a problem at the moment. In case of weak data from the eurozone and new dovish signal from the ECB only an upward test of 1.0875 will provide traders with a sell signal, thus pushing the price to the lows of 1.0843 and 1.0810, where it is recommended to lock in profits. Earlier, I emphasized that in case of a rise in the euro only a false break of 1.0925 will give the first sell signal. However, nothing important will happen if bears fail to protect this level. The euro will skyrocket only amid positive news about the Russia-Ukraine talks. However, we will hardly receive encouraging information in the near future. Thus, it will be wise to open short positions after a false break of 1.0970. It is also possible to go short from 1.1007 and 1.1041, expecting a decline of 20-25 pips.

Commitment of Traders Report
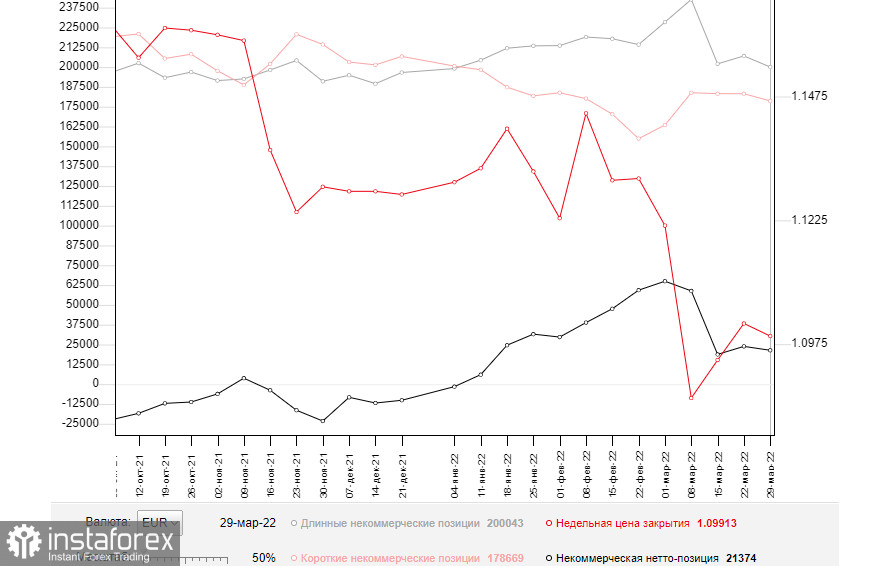
The COT report from March 29 unveiled a decrease in both short and long positions. Notably, the number of buyers who left the market exceeded the number of sellers who decided to stop trading. This fact points to pessimism among market participants caused by the current geopolitical situation. Meanwhile, a risk of higher inflation in the eurozone is the key issue for the ECB. Importantly, inflation has already jumped to 7.5%. Last week, Christine Lagarde several times emphasized the regulator's intention to switch to a more aggressive approach to the QE tapering and key interest rate hike. Against this background, the euro has a good mid-term prospect for growth. At present, the single currency is significantly oversold against the greenback. However, the absence of positive results in the Russia-Ukraine talks and a rise in the geopolitical tension have a negative influence on the euro. Economic problems in the eurozone provoked by extremely high inflation and responsive measures taken by Russia (including payments for gas in rubles) are likely to continue exerting pressure on the euro in the short term. That is why traders will hardly see a considerable increase in the pair. According to the COT report, the number of long non-commercial positions slid to 200,043 from 207,051. At the same time, the number of short non-commercial positions slumped to 178,669 from 183,208. Since a drop in the number of short positions turned out to be more significant, the overall non-commercial net position declined to 21,374 from 23,843. The weekly close price also dropped to 1.0991 from 1.1016.

Signals of indicators:
Moving Averages
Trading is conducted near 30- and 50-day moving averages, which indicates an attempt to form an upward correction.
Note: The period and prices of moving averages are considered by the author on the one-hour chart that differs from the general definition of the classic daily moving averages on the daily chart.
Bollinger Bands
If the euro rises, the upper limit of the indicator located at 1.0925 will act as resistance. In case of a drop, the lower limit of 1.0885 will act as a support level for the euro.
Description of indicators
- Moving average (moving average, determines the current trend by smoothing volatility and noise). The period is 50. It is marked in yellow on the chart.
- Moving average (moving average, determines the current trend by smoothing volatility and noise). The period is 30. It is marked in green on the graph.
- MACD indicator (Moving Average Convergence/Divergence - convergence/divergence of moving averages). A fast EMA period is 12. A slow EMA period is 26. The SMA period is 9.
- Bollinger Bands. The period is 20.
- Non-profit speculative traders are individual traders, hedge funds, and large institutions that use the futures market for speculative purposes and meet certain requirements.
- Long non-commercial positions is a total number of long positions opened by non-commercial traders.
- Short non-commercial positions is a total number of short positions opened by non-commercial traders.
- The total non-commercial net position is a difference in the number of short and long positions opened by non-commercial traders.


