Now, it is time for the Bank of England to make the move.
Hello, dear colleagues!
The FOMC Minutes published yesterday confirmed the intention of the US central bank to act more aggressively. At the same time, the regulator is going to raise interest rates and reduce the balance sheet faster than planned. The very decent state of the American economy, together with high inflation, leaves the regulator no other choice. Now, it is time for the Bank of England to make the move.
Of course, the state of the British economy is not good enough for aggressive moves. However, in the wake of persistent inflation and the already initiated monetary policy tightening process, we can assume the regulator will not stop halfway. Clearly, the British central bank is unlikely to act as aggressively as its American counterpart. In this light, the greenback will definitely be stronger than the pound sterling. Anyway, a lot will depend on how the market will react to possible actions by both regulators. And do not forget about the technical picture, which is often of greater importance than fundamentals. So, it is time to take a look at GBP/USD and see where this trading instrument can go in the short term.
Daily

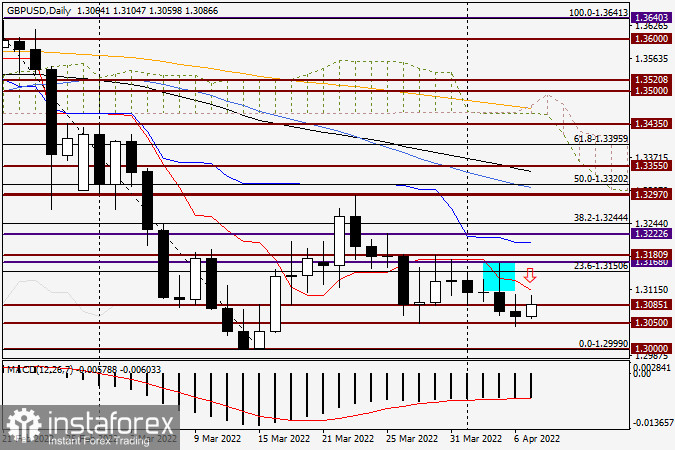
Honestly, there is a no-win situation on the daily chart. Yesterday's attempts of bears to break through the important technical level of 1.3050 failed despite the hawkish nature of the FOMC Minutes. Meanwhile, bulls also failed when trying to return the quote above the support level of 1.3085 and the key technical level of 1.3100. At the moment of writing, the pound/dollar pair is bullish. However, the price may well encounter resistance from the red Tenkan Line of the Ichimoku indicator at 1.3113. In case of consolidation above the Tenkan Line at the close of the trading day, the quote may head towards another strong and important price range of 1.3200-1.3220, in line with the blue Kijun Line as well as the resistance level at which the price peaked on March 25.
The shape of yesterday's daily candlestick could be regarded as a reversal signal by market players. I have noticed that as soon as such candlesticks emerge, the price starts to grow. Taking into account the market's weak reaction to the hawkish FOMC Minutes, I will not be surprised to see the quote rising today (perhaps not only today) and closing above the strong technical level of 1.3100. Should the price close above 1.3113, in line with the Tenkan Line, bullish bias will increase. Therefore, you may well try to sell and buy the pair today. Traders willing to take a risk may even try to go long at the current levels. In my view, however, it would be wiser to sell the pair right now. Technically, long positions could be opened from the 1.3110-1.3150 range. Anyway, bulls are now struggling to break above 1.3100. That is why we may now expect the bullish candlestick pattern to emerge below the mark in lower time frames and a signal to be made indicating to sell the pair immediately before it rises to the above-mentioned price range.
Have a nice trading day!


