Today's review of the pair of two North American dollars will be technical. However, before that, let's briefly talk about the positions of the Central Banks of the two countries. If the US Federal Reserve System shows an ardent "hawkish" attitude, which is based on the inflationary component, then their colleagues from the Bank of Canada are taking a more cautious position in their monetary policy. Nevertheless, since the Fed's intentions to aggressively tighten monetary policy are already more embedded in the price of the US dollar, which means that market participants have won back or continue to win back, rising oil prices support the "Canadian".
Weekly

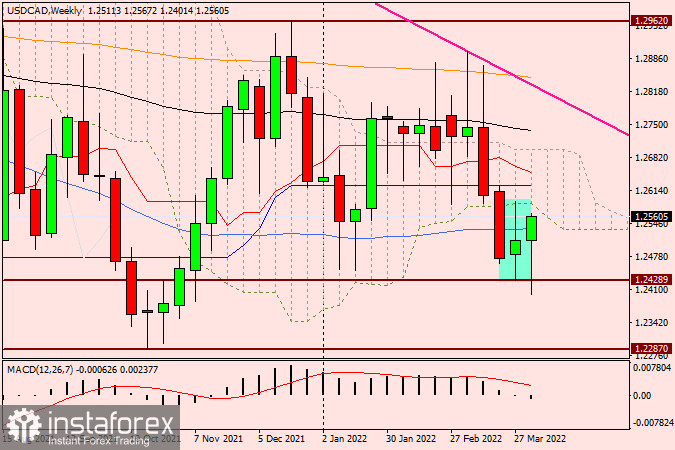
Although today is already Thursday, for the sake of completeness, I will begin the technical analysis with a weekly price chart. As you can see, the candle highlighted at the last auction, which had a reversal character, justifies its appearance. Despite the initial decline and the attempts of the bears on USD/CAD to push through the support level around 1.2430, the players could not carry out their plans to lower the exchange rate. There was only a puncture of this support level, after which a strong demand appeared for the pair, and it turned sharply in the north direction. The long lower shadow of the current candle indicates that the strength of the players on the decline has dried up. At the moment of writing this article, USD/CAD bulls are storming the blue 50 simple moving average for a breakdown.
It should also be noted that the pair is currently trading above the most important historical and psychological level of 1.2500. If the bulls do not loosen their grip and continue to move the course up, then the price will inevitably meet the lower limit of the weekly Ichimoku indicator cloud, which runs at 1.2587. If the pair manages to complete the current weekly trading within the Ichimoku cloud, the bullish sentiment for USD/CAD will significantly strengthen. In this case, the next target of the bulls for this trading instrument will be a strong and significant price area of 1.2600-1.2625. Judging by the weekly chart, I am more inclined to continue and further implement the bullish scenario. However, it can only be correctional, and this must be taken into account.
Daily

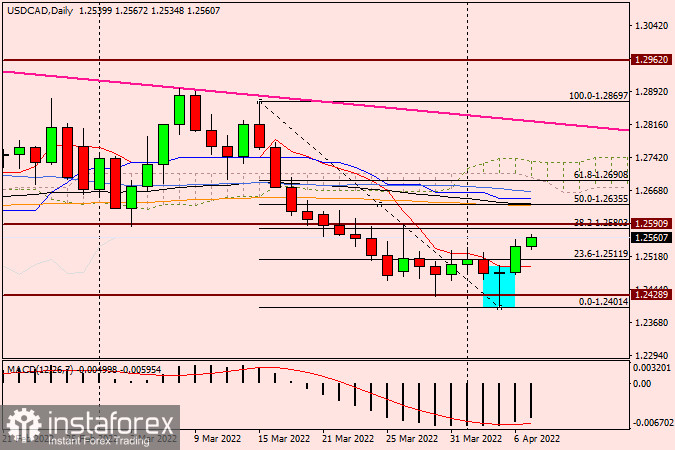
On the daily price chart, I recommend paying attention to the highlighted candle of the Doji variety for April 5. I believe that it became a strong reversal signal, and the subsequent course of trading confirms this opinion. According to the Fibonacci tool grid, stretched to a decrease of 1.2869-1.2401, we see that the pair is striving for the second pullback level from this movement of 38.2 Fibo. Then it is premature to draw unambiguous conclusions about the trading recommendations, since the current growth may be corrective, or maybe we are observing a trend change. At least, until USD/CAD goes up to the 50.0 Fibo level and the indicators 200 EMA, 89 EMA, the blue Kijun line, and the blue 50 MA, it is not quite correct to consider the bulls of the pair as the masters of the situation yet. Based on this, I recommend looking for bearish reversal candlestick signals, if they appear in the price zone of 1.2590-1.2640 at this or smaller time intervals. If there are any, a signal will be received to open short positions on USD/CAD. In my personal opinion, it's a little late to buy now, so I recommend focusing on looking for signals to open sales.


