


GBP/USD 5M
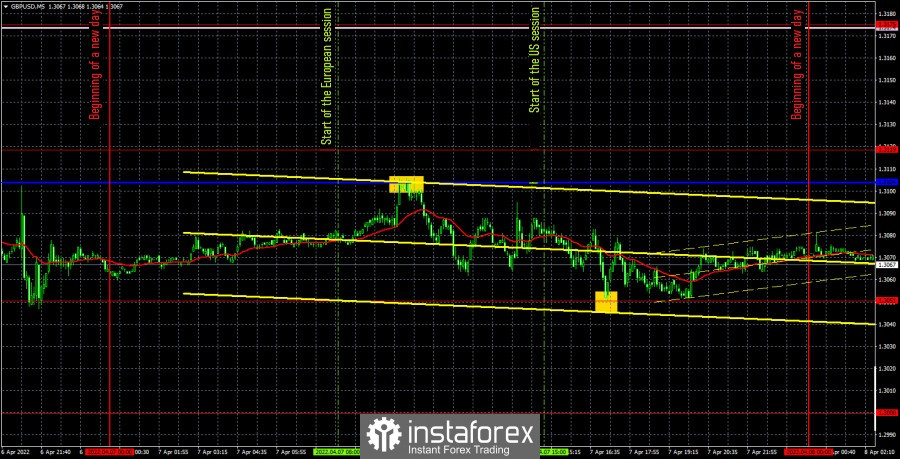
The GBP/USD currency pair, like the EUR/USD, did not show anything interesting. For most of the day, the pound was systematically declining and at the end of the day it was near its local lows near the extreme level of 1.3050. The pair again failed to overcome this level. As already mentioned in other articles, the most interesting news on Thursday concerned geopolitics. The situation in Ukraine remains difficult, but still the last week was relatively calm in 70% of the regions. Nevertheless, the "military operation" continues, as they openly talk about in the Kremlin. This means that we should expect a new round of escalation, just in other directions. Meanwhile, the European Parliament approved a resolution imposing an embargo on Russian oil, gas, coal and nuclear fuel. However, this resolution is just a recommendation from the European Commission led by Ursula von der Leyen. The European Union is still very dependent on hydrocarbons from Russia, so it is unlikely to refuse to buy them. However, today von der Leyen herself will visit Kyiv and, perhaps, her decision will change after this visit. From the UK, we have only received news regarding calls for a total embargo on hydrocarbons from Russia.
There were only two trading signals during the past day. The first one formed near the critical line of Kijun-sen, which during the day went down a little compared to our estimate yesterday. Thus, the rebound turned out to be perfect in accuracy, as was the subsequent fall, which ended just 1 pip from the level of 1.3050. It was near the critical line that the pair should have been sold, and near the level of 1.3050, profit should have been taken. This trade could earn about 35 points of profit. The signal to buy from the level of 1.3050 could also be worked out, but it did not bring profit to traders, as the pair managed to go up only 20 points. However, this was enough to set Stop Loss to breakeven, at which the deal was closed.
COT report:
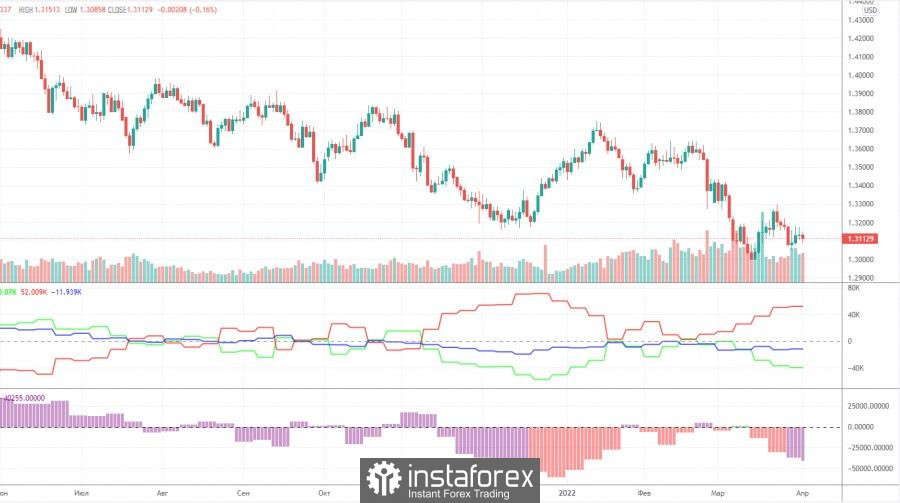
The latest Commitment of Traders (COT) report on the British pound showed minimal changes in the mood of major players. For a whole week, the non-commercial group opened only 700 short positions and closed 2,100 long positions. Thus, the net position of non-commercial traders decreased by 3,000. Even for the pound, such changes are insignificant. In general, the non-commercial group has almost 2.5 times more contracts for short positions than for longs. This means that the mood of professional traders is now "very bearish". Thus, this is another factor that speaks in favor of the continuation of the fall of the British currency. The situation with COT reports for the pound is completely different than for the euro. According to the pound, the mood of the major players changes every couple of months, and sometimes even faster. At this time, the "non-commercial" net position has already fallen to the levels where the last round of the pound's fall ended (the green line on the first indicator). Thus, we can even assume that in the coming weeks the pound will try to start a new ascent. However, much will again depend on geopolitics and technique. At the moment, the pound has a little more reason to grow than the euro. But there are plenty of factors of the fall.
We recommend to familiarize yourself with:
Overview of the EUR/USD pair. April 8. Ukrainian-Russian negotiations: a failure that no one wants to admit.
Overview of the GBP/USD pair. April 8. The Fed minutes only confirmed what everyone already knew.
Forecast and trading signals for EUR/USD on April 8. Detailed analysis of the movement of the pair and trading transactions.
GBP/USD 1H
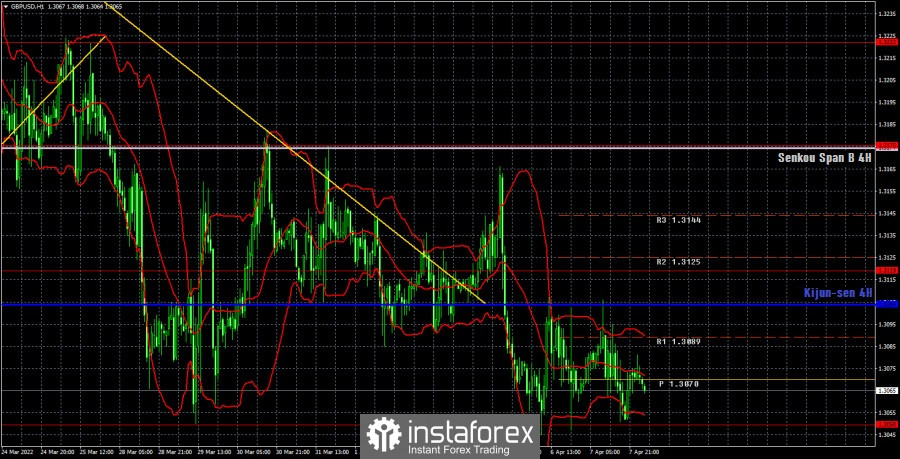
It is clearly seen on the hourly timeframe that the pair continues to move downward in general, but has not been able to overcome the level of 1.3050 in recent weeks. The trend is down, but there is no trend line at the moment, as the movement has stalled around the 1.3050 level. However, if this level is overcome, the pound may fall down with renewed vigor. This event may be facilitated by a new escalation of the conflict in Ukraine. We highlight the following important levels on April 8: 1.3000, 1.3050, 1.3119, 1.3175, 1.3222. Senkou Span B (1.3174) and Kijun-sen (1.3104) lines can also be sources of signals. Signals can be "rebounds" and "breakthroughs" of these levels and lines. The Stop Loss level is recommended to be set to breakeven when the price passes in the right direction by 20 points. Ichimoku indicator lines can move during the day, which should be taken into account when determining trading signals. The chart also contains support and resistance levels that can be used to take profits on trades. No important events are scheduled for Friday in the UK and the United States, so traders will have to rely only on geopolitical news when making trading decisions.
Explanations for the chart:
Support and Resistance Levels are the levels that serve as targets when buying or selling the pair. You can place Take Profit near these levels.
Kijun-sen and Senkou Span B lines are lines of the Ichimoku indicator transferred to the hourly timeframe from the 4-hour one.
Support and resistance areas are areas from which the price has repeatedly rebounded off.
Yellow lines are trend lines, trend channels and any other technical patterns.
Indicator 1 on the COT charts is the size of the net position of each category of traders.


