


Trend analysis (Fig. 1).
The market may move down from the level of 1.3070 (close of yesterday's daily candle) to the target of 1.3024, the support level (thick red line). In case of testing this level, the price may start moving up with the target of 1.3083, the 8-period EMA (thin blue line).
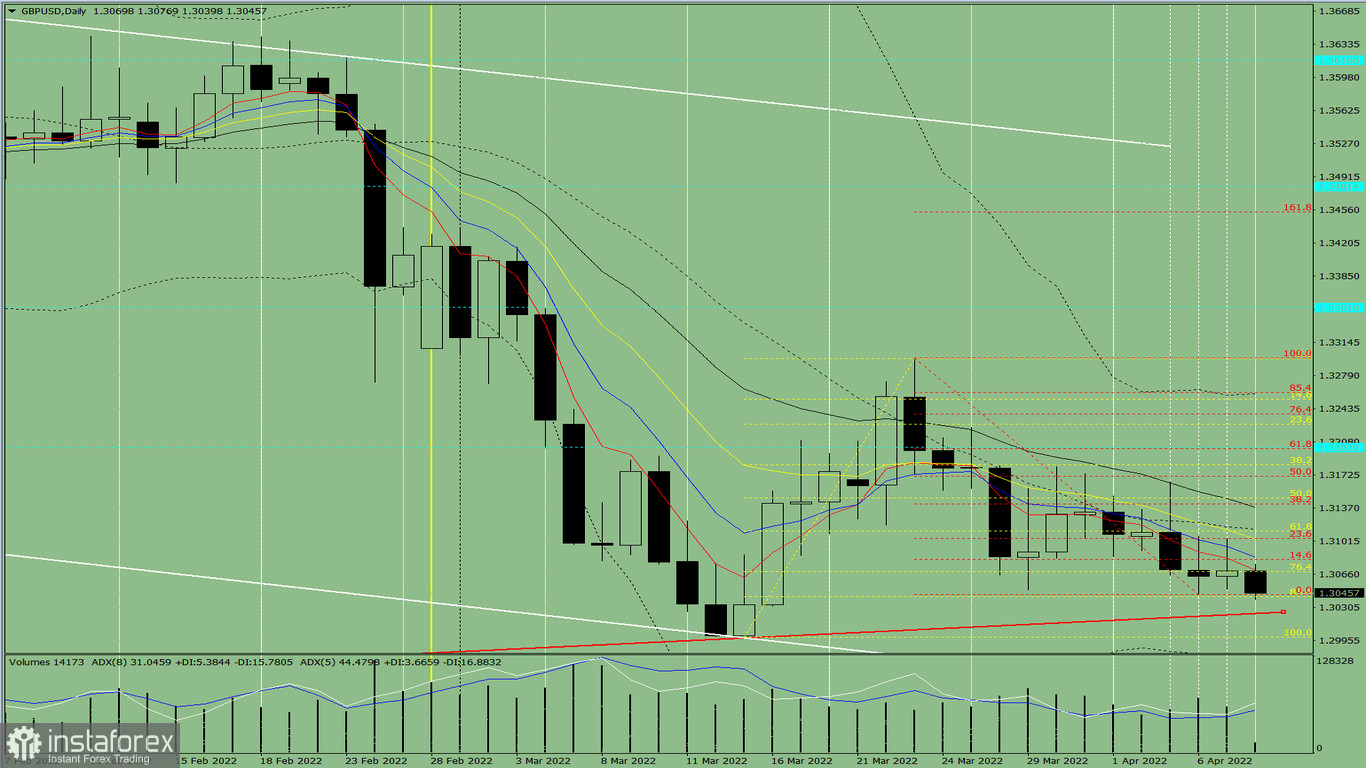
Fig. 1 (daily chart).
Comprehensive analysis:
- Indicator analysis - down;
- Fibonacci levels - down;
- Volumes - down;
- Candlestick analysis - down;
- Trend analysis - down;
- Bollinger bands - down;
- Weekly chart - down.
General conclusion :
Today, the price may move down from the level of 1.3070 (close of yesterday's daily candle) to the target of 1.3024, the support level (thick red line). In case of testing this level, the price may start moving up with the target of 1.3083, the 8-period EMA (thin blue line).
Unlikely scenario: from the level of 1.3070 (close of yesterday's daily candle), the price may continue moving down with the target of 1.2999, the lower fractal (yellow dotted line). In case of testing this level, the price may move upward with the target of 1.3085, the 8-period EMA (blue thin line). After testing this level, upward movement is possible.


