


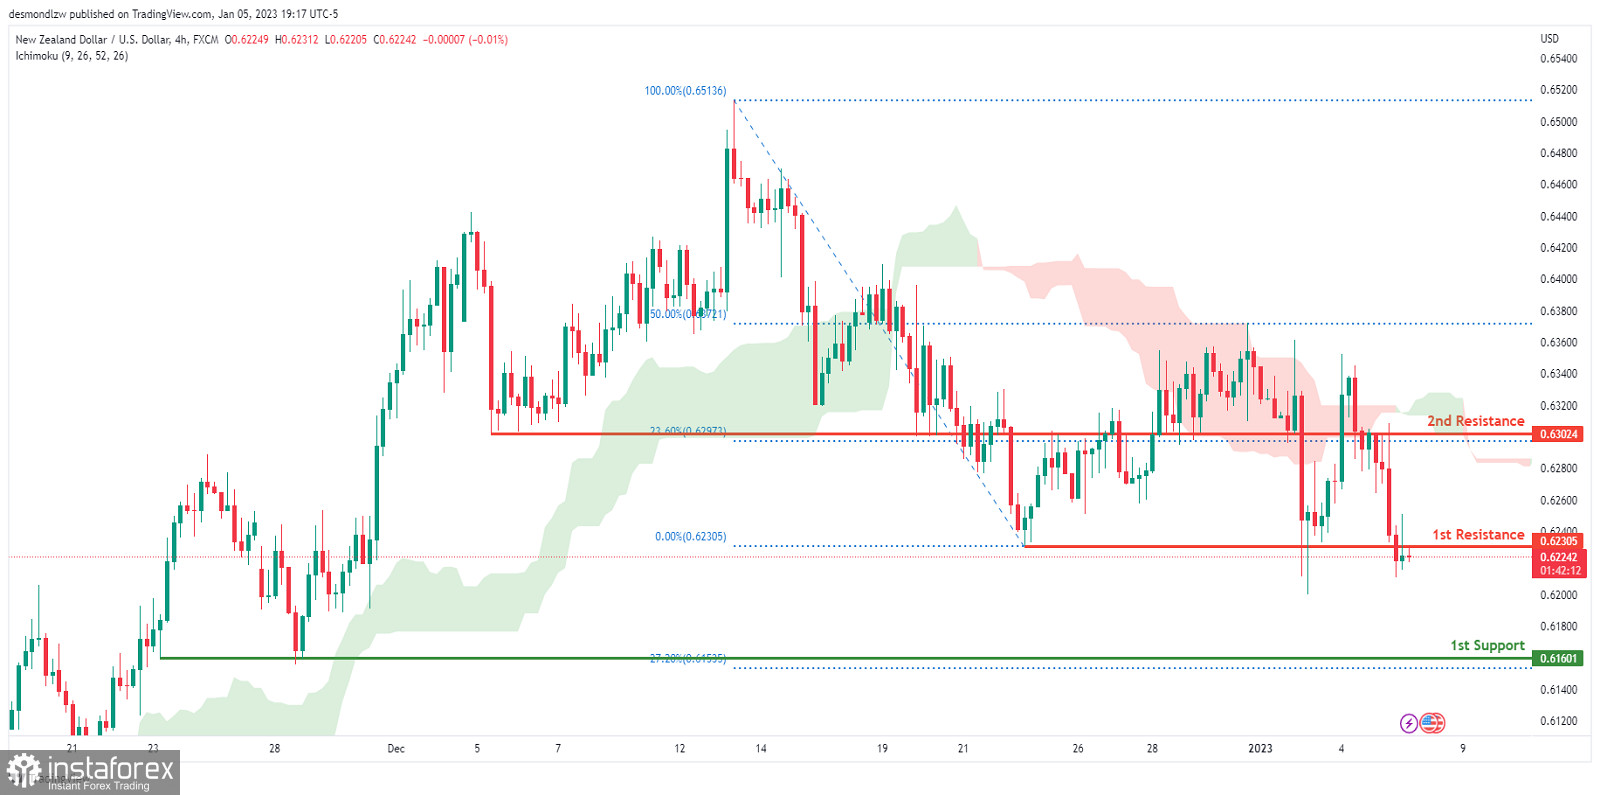
Looking at the H4 chart, my overall bias for NZDUSD is bearish due to the current price crossing below the Ichimoku cloud, indicating a bearish market. If this bearish momentum continues, expect price to possibly continue heading towards the 1st support at 0.61601, where the -27.2% Fibonacci line is. In an alternate scenario, price could possibly head back up breaking the 1st resistance level at 0.62305, where the previous swing low is, before heading towards the 2nd resistance at 0.63024, where the 23.6% Fibonacci line is
Trading Recommendation
Entry: 0.62305
Reason for Entry:
Sell limit entry to retest the 1st resistance line
Take Profit: 0.61601
Reason for Take Profit:1st support line
Stop Loss: 0.63024
Reason for Stop Loss:
2nd resistance line


