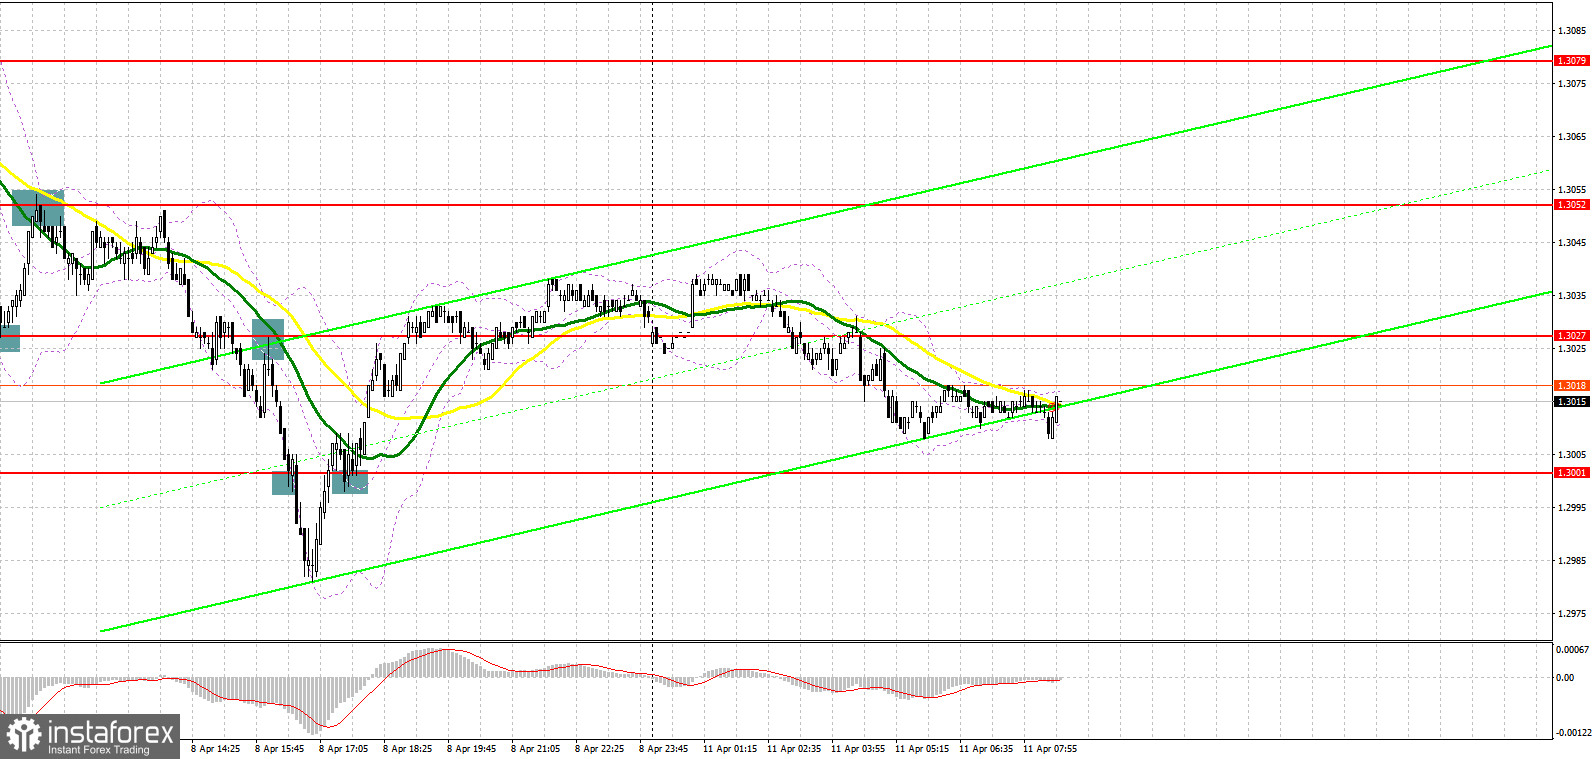
A fairly large number of trading signals were generated on Friday. Let's look at the 5-minute chart and figure out the entry points. In my morning forecast, I paid attention to levels of 1.3052 and 1.3027 and advised you to make decisions on entering the market. An instant breakthrough of 1.3052 took place immediately without a reverse test from the bottom up, so I missed the downward movement from this level. The emphasis shifted to 1.3027, where a false breakout allowed us to enter long positions perfectly. As a result, there was a growth back to 1.3052, which made it possible to pull about 30 points from the market. A false breakout at 1.3052 is a sell signal. As a result, the pound returned to 1.3027. A breakthrough and reverse test of this range from the bottom up of this range provided another signal to open short positions. As a result, the pair failed by another 30 points. The bull tried to catch on to 1.3001, but nothing came of it. Only amid profit-taking in the afternoon, a return and a false breakout of 1.3001 gave a buy signal, which brought more than 30 points of profit.

To open long positions on GBP/USD, you need:
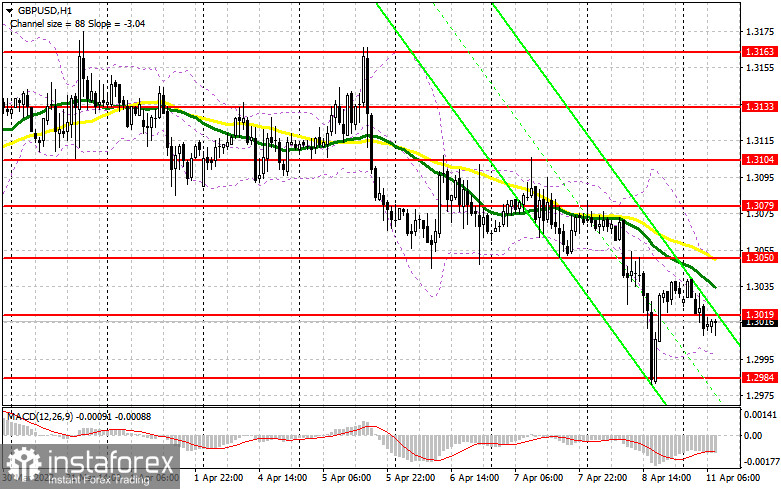
After surpassing the lower border of the horizontal channel, which led to the resumption of the bear market, pound bulls have zero chances. Hitting a new low in the area of 1.2985 last Friday proved it. Now bulls need to think about how to protect this range, since apparently the bears retreated on Friday only for a while. Only a false breakout at this level will lead to forming the first buy signal that can return GBP/USD to the area of 1.3019, just above which the moving averages are playing on the bears' side. If this scenario is implemented, a breakthrough and the 1.3019 test from top to bottom will create another entry point for opening long positions, which will strengthen the bulls and open the way to growth in the 1.3050 area. However, the upward movement from this level will depend on the UK data. Today, a number of indicators are being released on the change in the volume of GDP for February this year, the change in the volume of industrial production and the balance of visible trade. Only strong indicators, which are unlikely to be better than economists' forecasts, will lead to growth in the area of the more distant target of 1.3079, where I recommend taking profits. In case GBP/USD falls during the European session and the lack of activity at 1.2984, it is best to postpone long positions to a new low of 1.2950. I advise you to enter the market there only if there is a false breakout. You can buy GBP/USD immediately for a rebound from 1.2911, or even lower – in the area of 1.2856 and only while aiming for a correction of 30-35 points within the day.
To open short positions on GBP/USD, you need:
Weak data on the UK economy, on the contrary, will increase pressure on the pair. However, much will depend on whether bears will show themselves today in the area of 1.3019, or not. The primary task now is precisely the protection of this level, just above which the moving averages that play on the bears' side pass. Forming a false breakout there will provide an entry point into short positions in order to strengthen the bear market and pull the pair to the area of 1.2984. However, only very weak UK GDP data will make it possible to break through this range. A breakdown and a reverse test of 1.2984 will lead to the demolition of a number of bulls' stop orders and a sell signal, which will dump GBP/USD to the lows: 1.2950 and 1.2911. A more distant target will be the 1.2856 area, where I recommend taking profits. If the pair grows during the European session and bears are weak at 1.3019, this will not create any special problems for pound bears, but it is best to postpone short positions to 1.3050. I also advise you to open short positions there only in case of a false breakout. You can sell GBP/USD immediately for a rebound from the high of 1.3079, or even higher – from 1.3104, counting on the pair's rebound down by 30-35 points within the day.

I recommend for review:
The Commitment of Traders (COT) reports for March 29 logs an increase in short positions and contraction in long ones. This indicates concerns about ailing economic conditions in the UK and risks of higher inflation. These factors are likely to exert heavier pressure on British households. Experts say that the economic conditions in the Kingdom will get worse. For the time being, analysts find it hard to assess inflationary risks that are putting strain on the domestic economy. In this context, markets are disappointed with the softer stance of the Bank of England Governor. This won't allow buyers of risky assets to add long positions on the pound sterling because they cannot rely on further rate hikes. The only thing to cheer up the bulls is some positive outcome in the peace talks between Russia and Ukraine and steps towards peaceful solutions. At the same time, we should forget about the hawkish monetary policy of the Federal Reserve that sustains strong demand for the US dollar in the face of mounting risks of a recession in the second half of the year.
The COT report from March 29 reads that long non-commercial positions declined from 32,753 to 30,624 whereas short non-commercial positions increased from 69,997 to 70,694. As a result, the negative value of non-commercial net positions went up to -37,244 from -40,070. GBP/USD closed lower at 1.3099 against the closing price of 1.3169 a week ago.
Indicator signals:
Trading is conducted below the 30 and 50 moving averages, which indicates a further fall in the pound.
Moving averages
Note: The period and prices of moving averages are considered by the author on the H1 hourly chart and differs from the general definition of the classic daily moving averages on the daily D1 chart.
Bollinger Bands
In case of growth, the upper limit of the indicator around 1.3050 will act as resistance. In case the pound falls, the lower limit of the indicator in the area of 1.2985 will provide support.
Description of indicators
- Moving average (moving average, determines the current trend by smoothing out volatility and noise). Period 50. It is marked in yellow on the chart.
- Moving average (moving average, determines the current trend by smoothing out volatility and noise). Period 30. It is marked in green on the chart.
- MACD indicator (Moving Average Convergence/Divergence — convergence/divergence of moving averages) Quick EMA period 12. Slow EMA period to 26. SMA period 9
- Bollinger Bands (Bollinger Bands). Period 20
- Non-commercial speculative traders, such as individual traders, hedge funds, and large institutions that use the futures market for speculative purposes and meet certain requirements.
- Long non-commercial positions represent the total long open position of non-commercial traders.
- Short non-commercial positions represent the total short open position of non-commercial traders.
- Total non-commercial net position is the difference between short and long positions of non-commercial traders.


