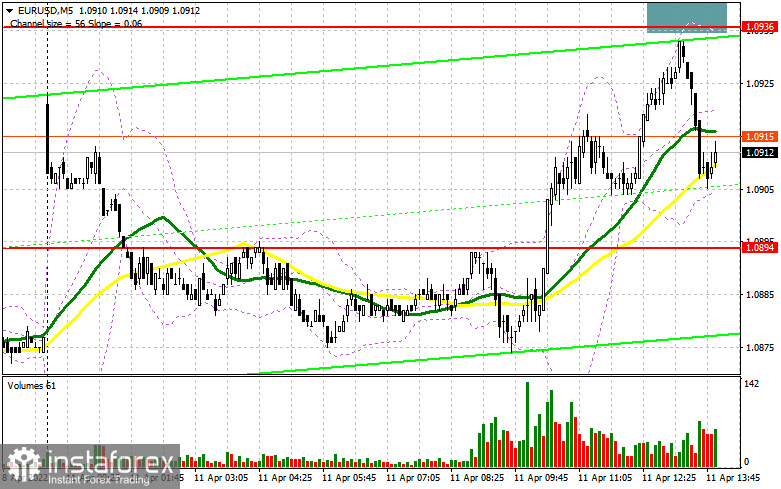
In my morning forecast, I outlined the level of 1.0894 as a good entry point. Let's take a look at the 5-minute chart and see what happened there. Due to the lack of fundamental statistics today and the fact that the opening price on Monday was higher than the closing price on Friday, the euro bulls managed to push the price above 1.0894 and reach 1.0930. Unfortunately, there wasn't any retest of this level from top to bottom, so I missed a buy signal. The pair also missed a couple of pips to reach 1.0936 where a false breakout could have been formed as a signal to sell the pair. For this reason, I haven't opened any trades in the first half of the day.

For long positions on EUR/USD:
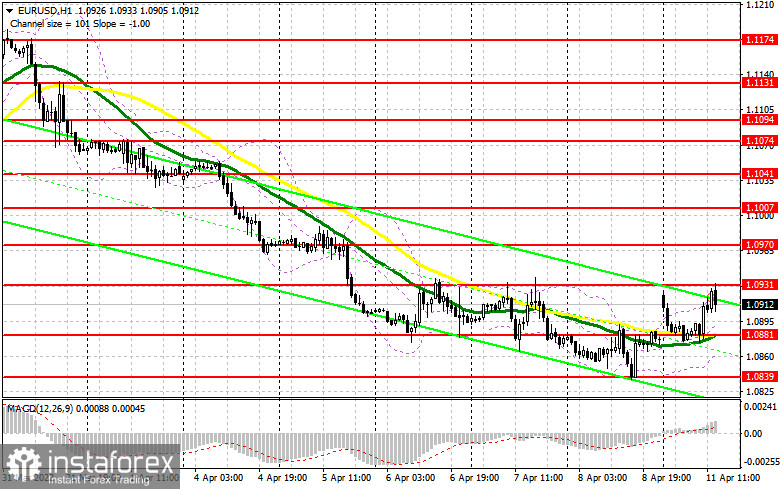
Given a rapid reversal to 1.0894, the technical picture for EUR/USD has partially changed in the afternoon. First of all, the previous support at 1.0894 has been shifted to 1.0881. No important economic reports are expected during the North American session, but Fed officials will give a statement today, which will most likely boost the demand for the US dollar. For this reason, bulls will have to protect the level of 1.0881, which coincides with the moving averages that support the bullish trend. If Michelle Bowman, Raphael Bostic, and Charles Evans make hawkish statements and EUR/USD declines to 1.0881, you can buy the euro only on a false breakout of this level. As I have mentioned in my morning review, in order to see a slowdown in the bearish trend, we need to see an increased activity near the level of 1.0931. As long as the pair is trading below this range, the market will remain in control of the bears. Besides, trading in a sideways channel may be tricky for those who buy risk assets as the price may resume a downtrend at any moment. This is exactly what happened to the pound last week. A breakout and a test of 1.0931 from top to bottom will create an additional signal for opening long positions and a possibility for EUR/USD to recover to 1.0970. A move above this level will trigger the stop-loss orders set by the sellers, thus opening the way towards the highs of 1.1007 and 1.1041. In case of a decline and low bullish activity at 1.0881, it is better to wait with opening buy positions. The best moment to buy would be a false breakout of the low around 1.0839. You can open long positions on the euro immediately on a rebound from 1.0810, or even lower at 1.0772, keeping in mind an upward correction of 30-35 pips within the day.
For short positions on EUR/USD:
Bears failed to fulfill their task in the morning to protect 1.0894. Yet, this does not mean that they lost control over the pair. Any escalation of tensions in Eastern Europe will put more pressure on the pair. The main task for bears is to protect the nearest resistance at 1.0931 which substituted the morning level of 1.0936. A false breakout of this level will put pressure on the euro and generate a sell signal with the downward target at the support level of 1.0881. Hawkish comments by the FOMC members will weigh on the market. Yet, for the bearish scenario to continue, the price needs to retest local lows every day. A breakout and a reverse test from bottom to top of the 1.0881 mark will form a sell signal. This will pave the way for the price towards the lows of 1.0839 and 1.0810 where I recommend taking profit. If the euro grows in the afternoon and bears show no activity around 1.0931, it is better to wait with selling the pair. A breakout of this range will trigger the stop orders set by the bears and push the euro up to the area of 1.0970. It would be better to place short positions when a false breakout is formed at this level. You can sell EUR/USD immediately on a rebound from 1.1007, or even higher at 1.1041, considering a downward correction of 25-30 pips.

COT report
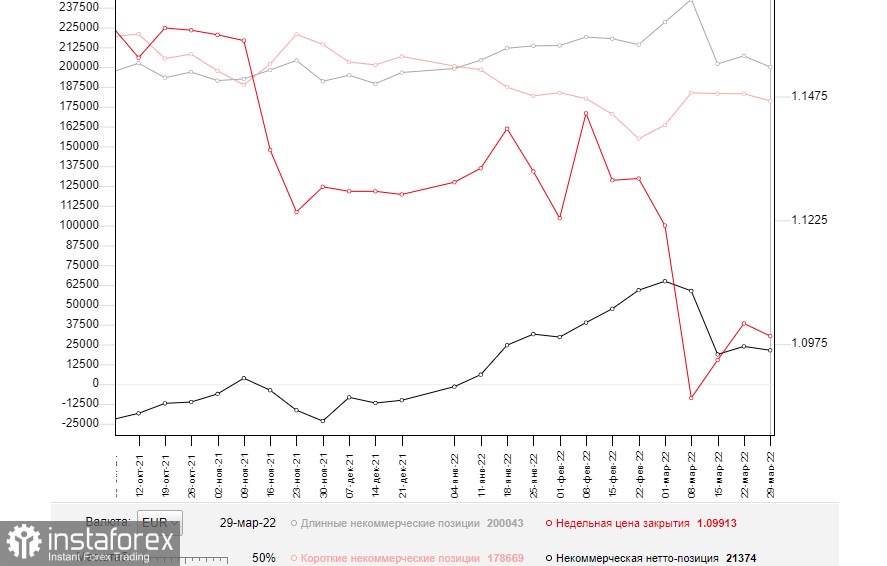
The COT (Commitment of Traders) report for March 29 recorded a reduction in both short and long positions. Remarkably, more buyers than sellers left the market. This clearly indicates the pessimism of the market players due to the geopolitical events that show no signs of improvement so far. The risk of higher inflation in the euro zone, which already reached 7.5% in March, is the main concern of the European Central Bank. Last week, ECB President Christine Lagarde repeatedly announced plans for a more aggressive monetary tightening, including rate hikes. This is good news for the euro in the medium term as it is now heavily oversold against the US dollar. However, the lack of progress in the negotiations between Russia and Ukraine has a negative impact on the euro. Difficulties that the European economy is already facing amid record inflation and anti-Russian sanctions (including the demand to pay for gas in rubles) will continue to put pressure on the euro in the short term. Therefore, it is better to keep in mind the downside potential of the euro/dollar pair. The COT report indicates that long positions of the non-commercial group of traders decreased from 207,051 to 200,043, while short ones fell from 183,208 to 178,669. Given that a drop in the short positions was larger, the non-commercial net position fell to 21,374 versus 23,843. The weekly closing price dropped to 1.0991 from 1.1016.

Indicator signals:
Moving Averages
Trading above 30- and 50-day moving averages indicates that bulls are trying to regain control of the market.
Please note the time period and prices of moving averages are analyzed only for the H1 chart which differs from the general definition of the classic daily moving averages on the D1 chart.
Bollinger Bands
The upper band of the indicator at 1.0931 will serve as resistance in case of growth. A breakout of the lower boundary around 1.0852 will trigger a deeper fall in the pair.
Description of indicators:
• A moving average determines the current trend by smoothing volatility and noise. 50-day period; marked in yellow on the chart;
• A moving average determines the current trend by smoothing volatility and noise. 30-day period; marked in green on the chart;
• MACD Indicator (Moving Average Convergence/Divergence) Fast EMA, 12-day period; Slow EMA, 26-day period. SMA with a 9-day period;
• Bollinger Bands: 20-day period;
• Non-commercial traders are speculators such as individual traders, hedge funds, and large institutions who use the futures market for speculative purposes and meet certain requirements;


