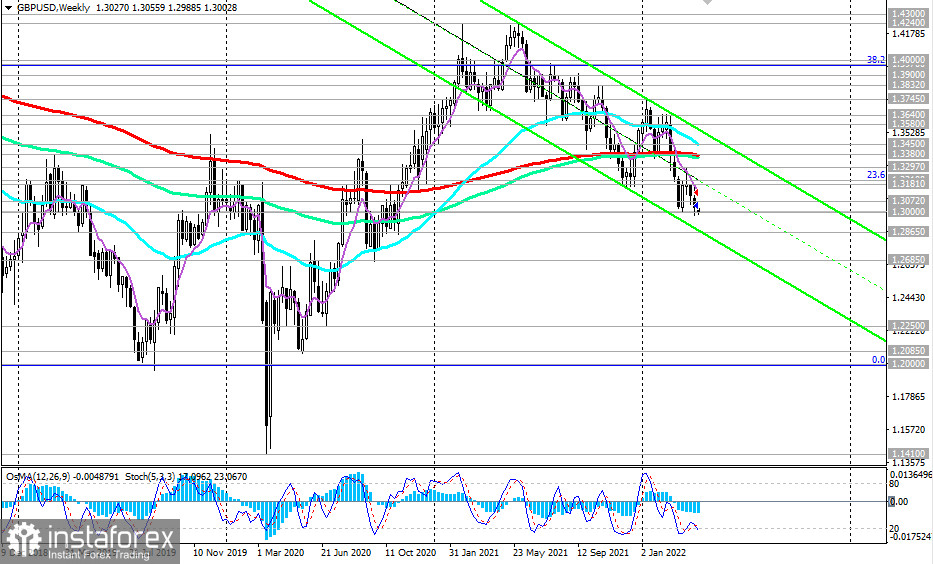
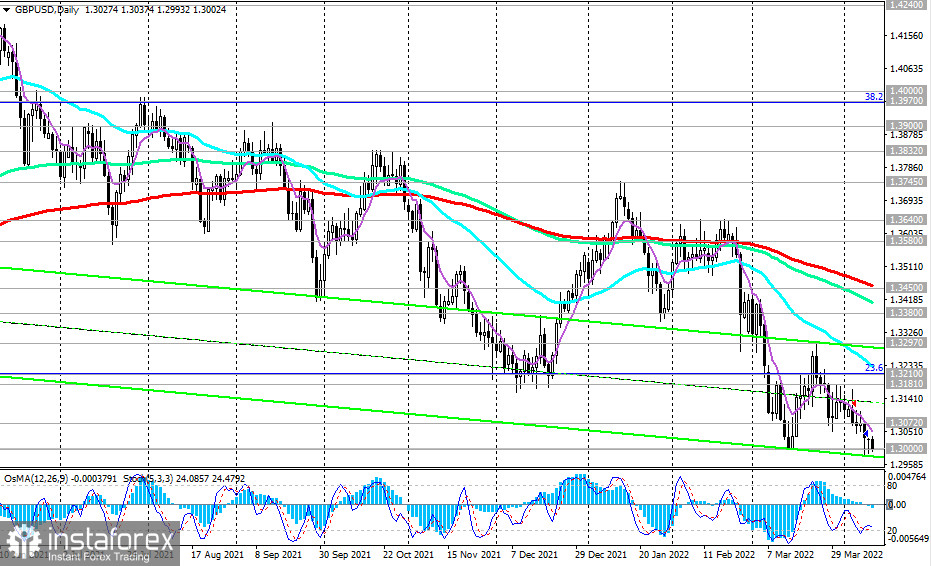
Unlike the Bank of England, the Federal Reserve is taking a tougher stance on rising inflation, and the widening divergence between the monetary policies of the Fed and the BoE is likely to increase, creating prerequisites for a further decline in GBP/USD.

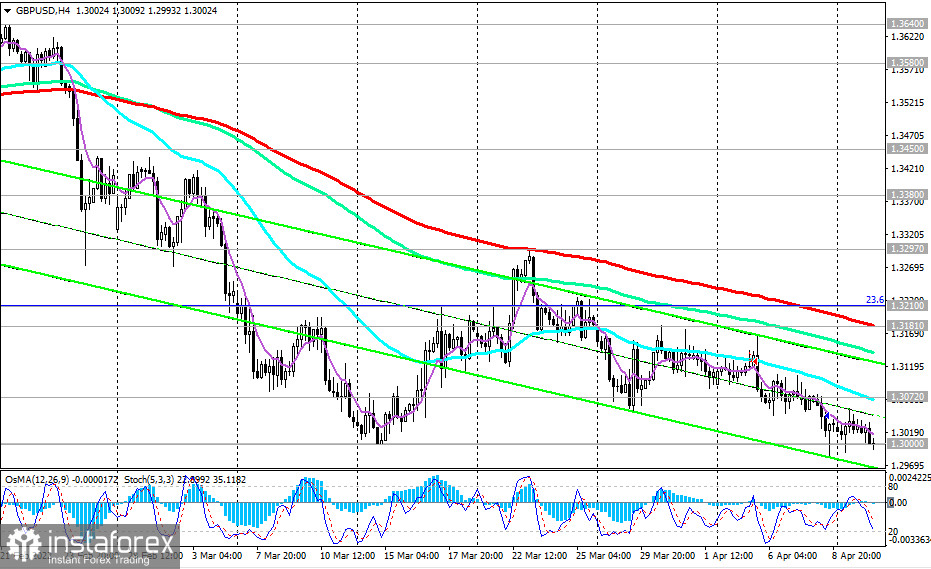
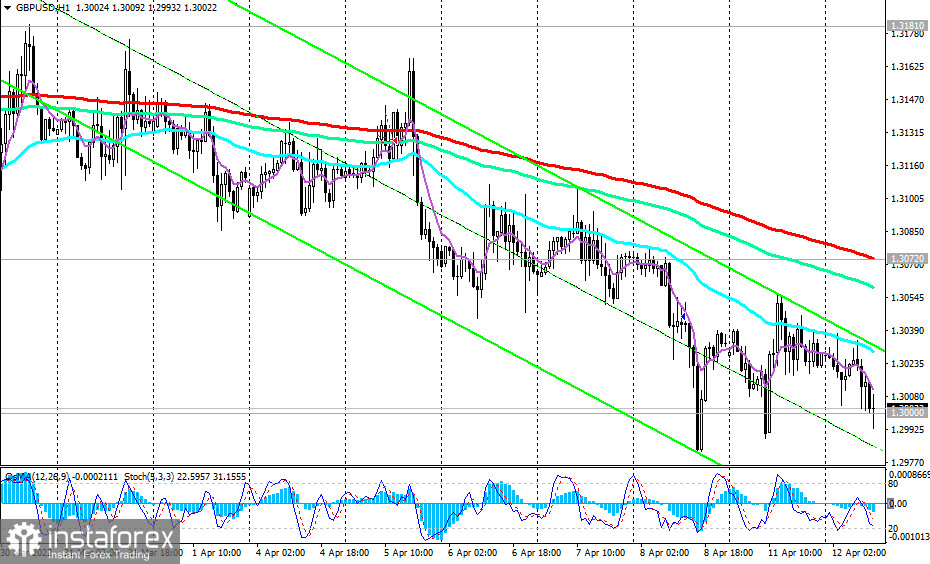
Our main scenario still assumes a decline in GBP/USD. The first signal for the resumption of short positions may be the breakdown of the recent low and the local support level of 1.2980.

The nearest target of the decline is the 1.2865 mark, through which the lower border of the descending channel passes on the weekly chart. A breakdown of this support level will strengthen the negative dynamics of GBP/USD, sending the pair towards local lows of 1.2685, and 1.2400.
The more distant targets for the decline of GBP/USD are located at the local support levels of 1.2250, 1.2085, and 1.2000 (the low in the GBP/USD decline that began in July 2014 near the level of 1.7200).

In an alternative scenario, and after the breakdown of the resistance level of 1.3072 (200 EMA on the 1-hour chart), GBP/USD will resume growth. The target of this upward correction may be the resistance levels of 1.3181 (200 EMA on the 4-hour chart), 1.3210 (23.6% Fibonacci retracement level to the decline of GBP/USD in the wave that began in July 2014 near the level of 1.7200), 1.3230 (50 EMA on the daily chart).

However, only growth in the zone above the resistance levels of 1.3450 (200 EMA on the daily chart), 1.3580 (200 EMA on the weekly chart) can reverse the situation, increasing the probability of GBP/USD growth in the long-term bull market zone above the key resistance level of 1.4580 (200 EMA on the monthly chart and the 50% Fibonacci level). The first signal for the implementation of this scenario may be a breakdown of the local resistance level of 1.3040.
Support levels: 1.3000, 1.2980, 1.2865, 1.2685, 1.2400, 1.2250, 1.2085, 1.2000
Resistance levels: 1.3040 1.3072 1.3181 1.3210 1.3297 1.3380 1.3450 1.3580 1.3640 1.3700 1.3745 1.3832 1.3900 1.3970 1.4580
Trading tips
Sell Stop 1.2970. Stop-Loss 1.3050. Take-Profit 1.2865, 1.2685, 1.2400, 1.2250, 1.2085, 1.2000
Buy Stop 1.3050. Stop-Loss 1.2970. Take-Profit 1.3072, 1.3181, 1.3210, 1.3297, 1.3380, 1.3450, 1.3580, 1.3640, 1.3700, 1.3745, 1.3832, 1.3900, 1.3970, 1.4000, 1.4580


