


Analysis of Tuesday's trades:
30M chart of GBP/USD
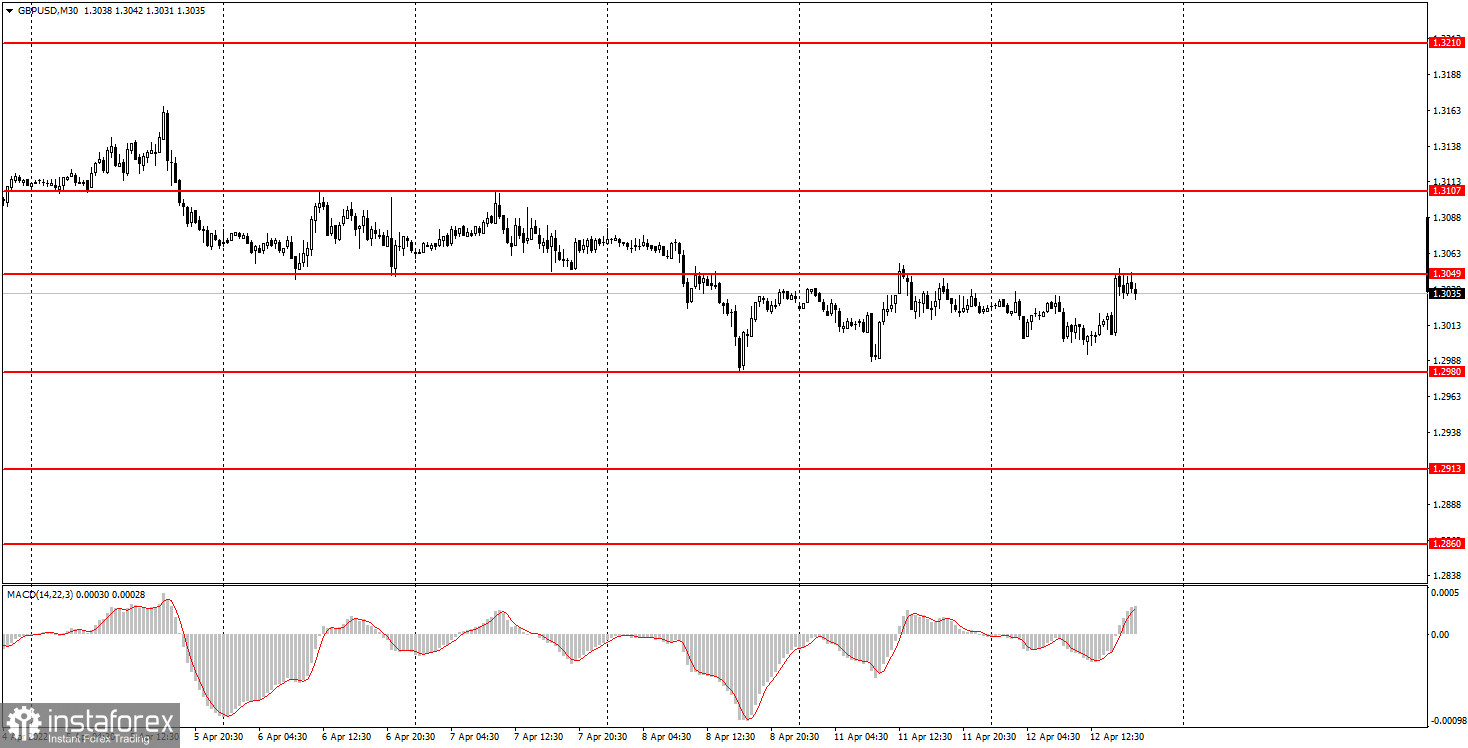
On Tuesday, GBP/USD traded in the sideways channel between 1.2980 and 1.3049, unable to leave the range for the third day in a row. The price managed to rise to the upper limit but then pulled back. In addition, GBP traded at the trough. The last time the quote went below 1.2980 was about 18 months ago. Nevertheless, the market was in no rush to buy GBP, which means the downtrend might extend in the next several weeks. The United Kingdom saw the release of a few macro reports of secondary importance. The unemployment in the country fell in February as well as the claimant count, while wages increased more than expected. In this light, GBP had every reason for growth. Yet, it didn't happen. Meanwhile, the greenback showed no reaction to inflation results coming in line with the market consensus of 8.5%. Instead, it plunged by 40 pips. All in all, sideways movement is difficult to foresee.
5M chart of GBP/USD
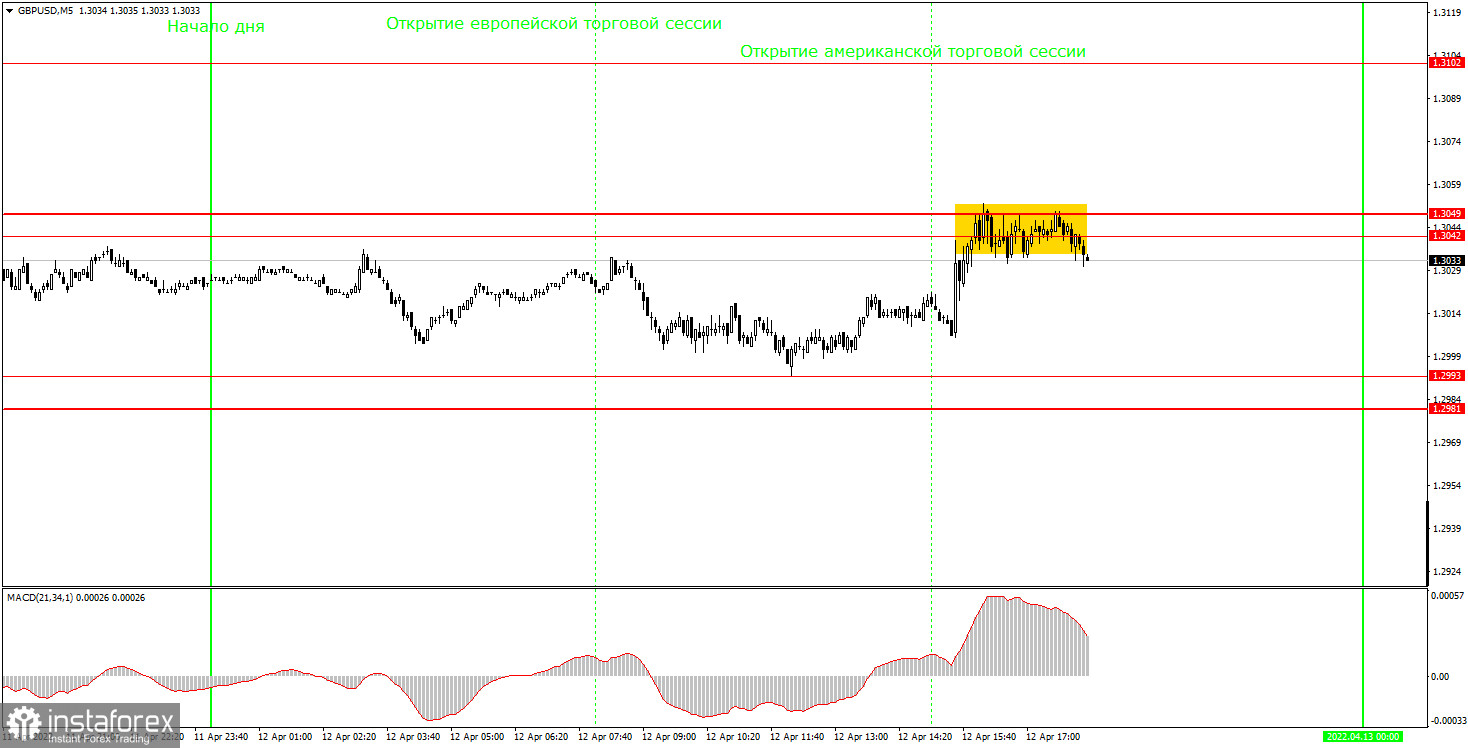
In the M5 time frame, the quote traded sideways in the range between 1.2981 and 1.3049 on Tuesday. The level of 1.2993, Tuesday's low, didn't take part in trading. Therefore, a rebound from it in the middle of the European session couldn't be interpreted as a buy signal. Generally speaking, no trading signals were made during the day. The pair rose to the 1.3042-1.3049 range during the North American session. However, neither a breakout nor a pullback occurred. On Tuesday, volatility totaled just 60 pips. In this light, the fact that no signals were made could be a good thing. Given such low volatility and a flat market, you can't expect profitable trading.
Trading plan for Wednesday:
In the 30M time frame, the pair traded sideways as well. The market will remain flat for as long as the quote stays within the sideways channel. In case of a breakout at 1.3049, beginner traders should not expect significant growth in GBP as a fall seems to be more likely given the fundamental, geopolitical, and macroeconomic backgrounds. On Wednesday, the target levels in the 5M time frame are seen at 1.2913, 1.2981-1.2993, 1.3042-1.3049, 1.3102, and 1.3156. A stop-loss order should be set at the breakeven point as soon as the price passes 20 pips in the right direction after a trade has been opened. The UK inflation rate will be the only macro report released in the country on Wednesday. Figures are expected to accelerate in March to 6.7% y/y. The pair's illogical reaction to the macro result on Tuesday shows that the quotes may again go in any direction during the European session.
Basic principles of the trading system:
1) The strength of the signal depends on the time period during which the signal was formed (a rebound or a break). The shorter this period, the stronger the signal.
2) If two or more trades were opened at some level following false signals, i.e. those signals that did not lead the price to the Take Profit level or the nearest target levels, then any consequent signals near this level should be ignored.
3) During the flat trend, any currency pair may form a lot of false signals or produce no signals at all. In any case, the flat trend is not the best condition for trading.
4) Trades are opened in the time period between the beginning of the European session and until the middle of the American one when all deals should be closed manually.
5) We can pay attention to the MACD signals in the 30M time frame only if there is good volatility and a definite trend confirmed by a trend line or a trend channel.
6) If two key levels are too close to each other (about 5-15 pips), then this is a support or resistance area.
How to interpret charts:
Support and resistance levels can serve as targets when buying or selling. You can place Take Profit near them.
Red lines are channels or trend lines that display the current trend and show which direction is better to trade.
MACD indicator (14,22,3) is a histogram and a signal line showing when it is better to enter the market when they cross. This indicator is better to be used in combination with trend channels or trend lines.
Important speeches and reports that are always reflected in the economic calendars can greatly influence the movement of a currency pair. Therefore, during such events, it is recommended to trade as carefully as possible or exit the market in order to avoid a sharp price reversal against the previous movement.
Beginner traders should remember that every trade cannot be profitable. The development of a reliable strategy and money management is the key to success in long-term trading.


