


GBP/USD
Analysis:
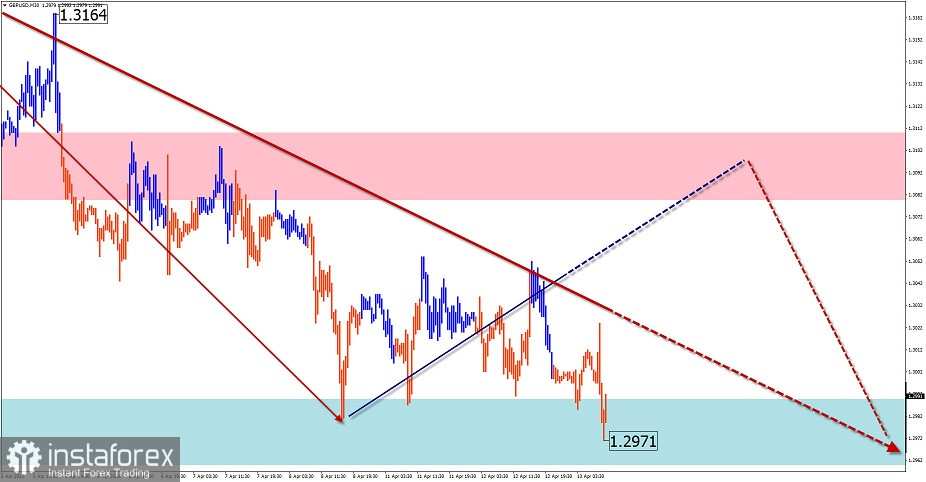
The British pound sterling continues its decline against the US dollar which started a year ago. An incomplete wave on a smaller time frame dates back to March 23. The price has been forming a correction within this wave for the past three weeks. After its completion, the downtrend will continue.
Forecast:
Today, we expect the pair to trade in a flat channel. The boundaries of the channel are formed by the nearest opposite zones. In the first half of the day, an upward movement is likely. At the end of the day or tomorrow, the quote may resume a decline from the resistance zone.
Potential reversal zones
Resistance:
- 1.3080/1.3110
Support:
- 1.2990/1.2960
Recommendations:
Today, it is possible to trade the British pound only within separate trading sessions with a fractional lot. Selling the pair from the resistance zone seems a better option.
AUD/USD
Analysis:
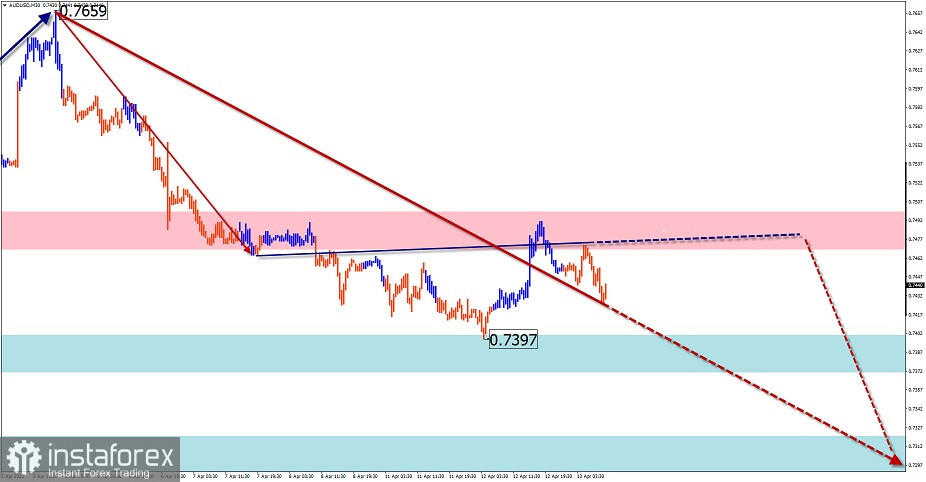
The descending wave from April 5 forms a correction against the trend that started on January 28. As part of this wave, the middle part (B) of the wave structure is about to be completed. The downward movement that started yesterday has a reversal potential.
Forecast:
In the first half of the day, the price is likely to move along the lower boundary of the resistance zone. By the end of the session, we can expect increased volatility and the resumption of the bearish sentiment. If the price breaks through the nearest support, the decline will continue up to the next zone.
Potential reversal zones
Resistance:
- 0.7470/0.7500
Support:
- 0.7400/0.7400
- 0.7320/0.7290
Recommendations:
Currently, there are no conditions for buying the Australian dollar. It is recommended to track all emerging reversal signals to sell the instrument.
USD/CHF
Analysis:
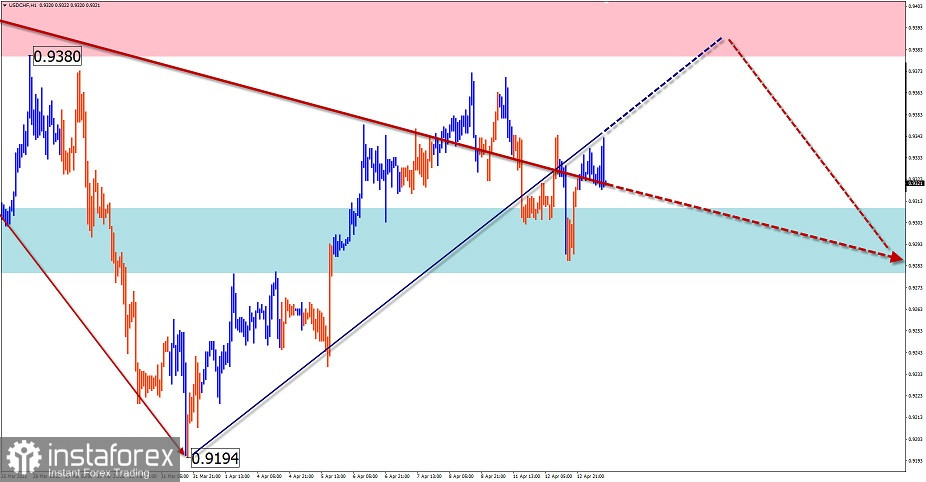
The incomplete wave structure on the USD/CHF chart dates back to March 16 and is pointing downwards. It is completing its formation in a larger downward channel. In the last two weeks, the price has been moving up, forming a pullback. At the moment of writing, the pullback does not look complete.
Forecast:
In the next 24 hours, the pair is expected to move higher up to the supposed resistance zone. Then a reversal and a resumption of the downtrend are possible.
Potential reversal zones
Resistance:
- 0.9380/0.9410
Support:
- 0.9310/0.9280
Recommendations:
It is possible to trade in the USD/CHF market today within individual trading sessions with a small lot. It is recommended to sell the pair only after getting confirmed signals of a reversal near the area of resistance.
USD/CAD
Analysis:
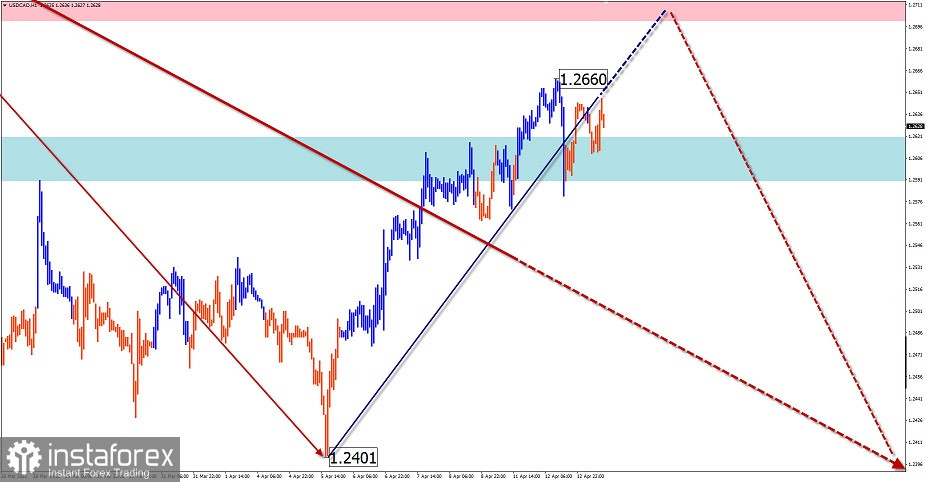
Over the past year and a half, the USD/CAD pair has been forming a descending channel. The last incomplete wave section dates back to March 8. In the last two weeks, a counter correction has been developing on the chart.
Forecast:
In the near future, the price is likely to move from the support zone to the supposed resistance area. This is where a strong potential reversal zone is located on the weekly chart. At this point, we can expect a reversal and a subsequent decline.
Potential reversal zones
Resistance:
- 1.2700/1.2730
Support:
- 1.2620/1.2590
Recommendations:
It is possible to open buy positions on USD/CAD for the short term. The pair has the potential to rise up to the supposed resistance level. It is better to trade with a small lot.
Explanation: In simplified wave analysis (SWA), waves consist of 3 parts (A-B-C). We analyze the last unfinished wave. The solid arrow background shows the structure that has been formed. The dashed lines show the expected movements.
Note: The wave algorithm does not take into account the duration of the instrument's movements over time!


