


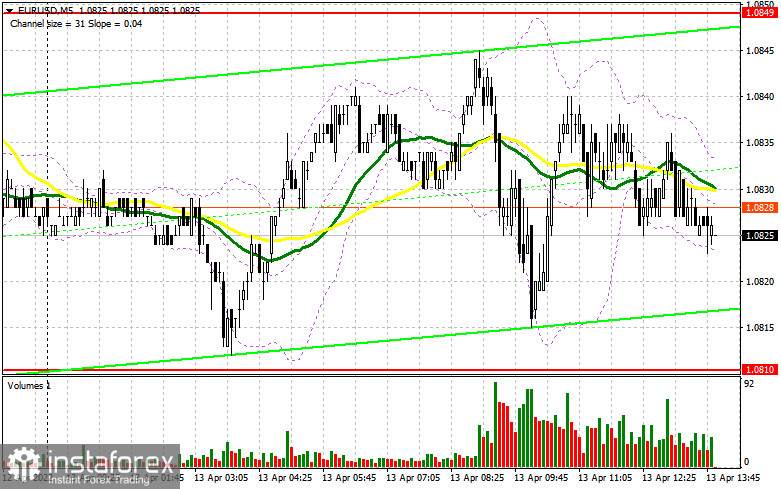
The EU released macroeconomic reports in the first half of the day. They did not trigger a surge in volatility in the EUR/USD pair. In the morning article, I highlighted the level of 1.0849 and recommended taking decisions with this level in focus. Now, let's look at the 5-minute chart and try to figure out what actually happened. The euro/dollar pair made an attempt to reach the indicated resistance level at the very beginning of the European session amid upbeat industrial production data for Italy. However, it failed. As a result, I did not wait for a false breakdown from this level to open short positions. The price also did not touch the nearest support level of 1.081. For this reason, the technical outlook for the second half of the day, as well as the strategy, have not changed.
What is needed to open long positions on EUR/USD
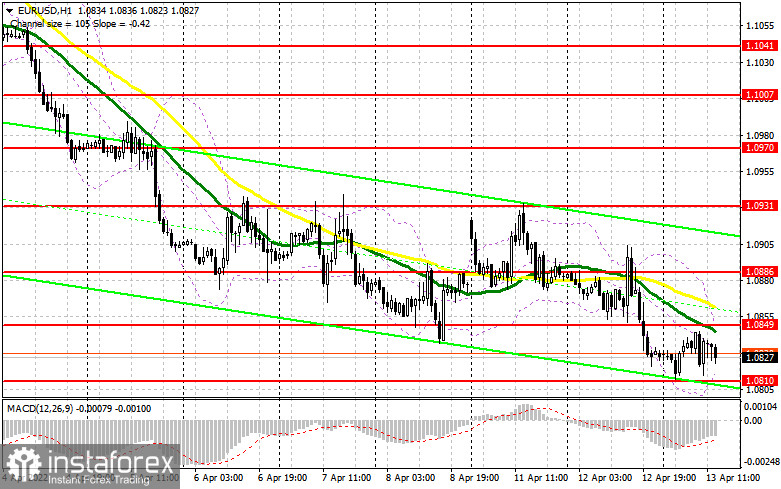
Despite the fact that bears do not show any buoyant activity now, the sentiment remains bearish. In the afternoon, the US producer price index is on tap. This data may spur up demand for the US dollar. If so, the pair will maintain its downward trend. The US inflation report published yesterday confirmed once again the need to tighten monetary policy. Now, even fewer traders are willing to buy EUR/USD. Only a false breakout at 1.0810 will generate the first entry point into long positions. The downward movement may slow down if the price consolidates above 1.0849. There are moving averages at this level that limit the upward potential. A breakout and a downward test of this level may give an additional buy signal. If this scenario comes true, the pair is likely to rise to 1.0886. Yesterday, it was unable to consolidate above this level. If the pair climbs above this level, there could be a drop in bears' stop orders. It will open the way to the highs of 1.0931 and 1.0970. If the pair keeps dropping and bulls show no energy at 1.0810, it is better to postpone long positions. The optimal scenario for opening long positions would be a false breakout of the low of 1.0772. It is recommended to buy the euro immediately on a rebound only from 1.0728 or even a lower low around 1.0636, keeping in mind an upward intraday correction of 30-35 pips.
What is needed to open short positions on EUR/USD
Bears are now sitting on the sidelines. It may be associated with the sideways range that formed yesterday in the morning. Today, the pair still remains in this range. However, when US traders come to market, the situation may change drastically. The bears need to protect the nearest resistance level of 1.0849 as the future trajectory of the pair depends on this level. There are moving averages at this level that are passing in the negative territory. In case of a false breakout, the pressure on the pair will increase. There could be a sell signal and a further drop of the pair to the support level of 1.0810. To strengthen the bearish sentiment, it is important to push the pair to intraday lows. So, a breakout and an upward test of 1.0810, as well as a sharp jump in the US producer prices, will generate a sell signal. The pair could slip to the lows of 1.0772 and 1.0728, where I recommend profit-taking. If the euro rises in the afternoon and bears show no activity at 1.0849, there is no reason to worry. The euro may perform a sharp upward reversal only if there are positive shifts in the negotiations between Russia and Ukraine. However, there are none. Besides, the parties are unlikely to resume talks in the near future. This is why it is recommended to open short positions if a false breakout at 1.0886 occurs. The optimal scenario is to sell EUR/USD immediately on a rebound from 1.0931 or even a higher high around 1.0970, keeping in mind a downward upward correction of 25-30 pips.
COT report
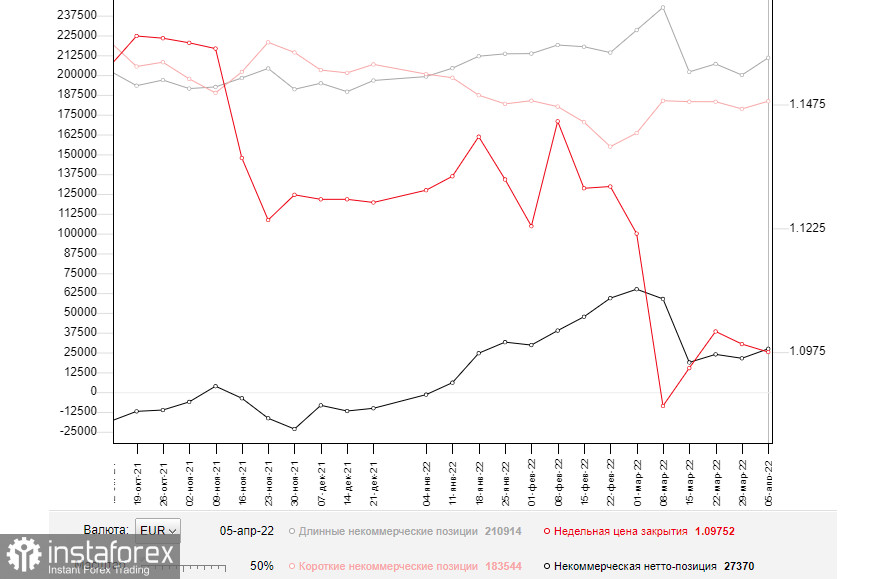
The COT report (Commitment of Traders) for April 5 logged an increase in both short and long positions. Notably, the number of buyers exceeded the number of sellers. The bullish sentiment revived amid expectations of more aggressive measures from the ECB. The regulator has recently made some hints about the possibility of monetary policy tightening. However, the absence of positive news about the Russia-Ukraine talks and rising geopolitical tension are still having a negative influence on the euro. That is why bulls cannot form a strong upward correction. Traders are looking forward to inflation reports from the EU and the US. These figures will show the pace of inflation growth after the start of Russia's special military operation. This data will also help central banks choose a stance on monetary policy. It will partially impact the further trajectory of the EUR/USD pair. The COT report revealed that the number of long non-commercial positions increased to 210,914 from 200,043, while the number of short non-commercial positions jumped to 183,544 from 178,669. Since the rise in the number of short positions was less significant than a jump in the number of long positions, the general non-commercial net position advanced to 27,370 compared to 21,374. The weekly close price slipped to 1.0776 from 1.0991.
Signals of technical indicators
Moving averages
EUR/USD is trading below 30- and 50-period moving averages. It means that the pair is likely to continue its downward movement.
Remark. The author is analyzing a period and prices of moving averages on the 1-hour chart. So, it differs from the common definition of classic daily moving averages on the daily chart.
Bollinger Bands
In case of a rise, the upper limit of the indicator around 1.0850 will act as resistance. A break of the lower limit of the indicator at 1.0820 will lead to a larger decline in the pair.
Definitions of technical indicators
- Moving average recognizes an ongoing trend through leveling out volatility and market noise. A 50-period moving average is plotted yellow on the chart.
- Moving average identifies an ongoing trend through leveling out volatility and market noise. A 30-period moving average is displayed as the green line.
- MACD indicator represents a relationship between two moving averages that is a ratio of Moving Average Convergence/Divergence. The MACD is calculated by subtracting the 26-period Exponential Moving Average (EMA) from the 12-period EMA. A 9-day EMA of the MACD called the "signal line".
- Bollinger Bands is a momentum indicator. The upper and lower bands are typically 2 standard deviations +/- from a 20-day simple moving average.
- Non-commercial traders - speculators such as retail traders, hedge funds and large institutions who use the futures market for speculative purposes and meet certain requirements.
- Non-commercial long positions represent the total long open position of non-commercial traders.
- Non-commercial short positions represent the total short open position of non-commercial traders.
- The overall non-commercial net position balance is the difference between short and long positions of non-commercial traders.


