


Details of the economic calendar from April 15
Last week ended with a day off in Europe, Britain, the United States, Switzerland, Canada, Australia, and New Zealand due to the celebration of Good Friday. This led to a reduction in trading volumes and low volatility in the market.
Analysis of trading charts from April 15
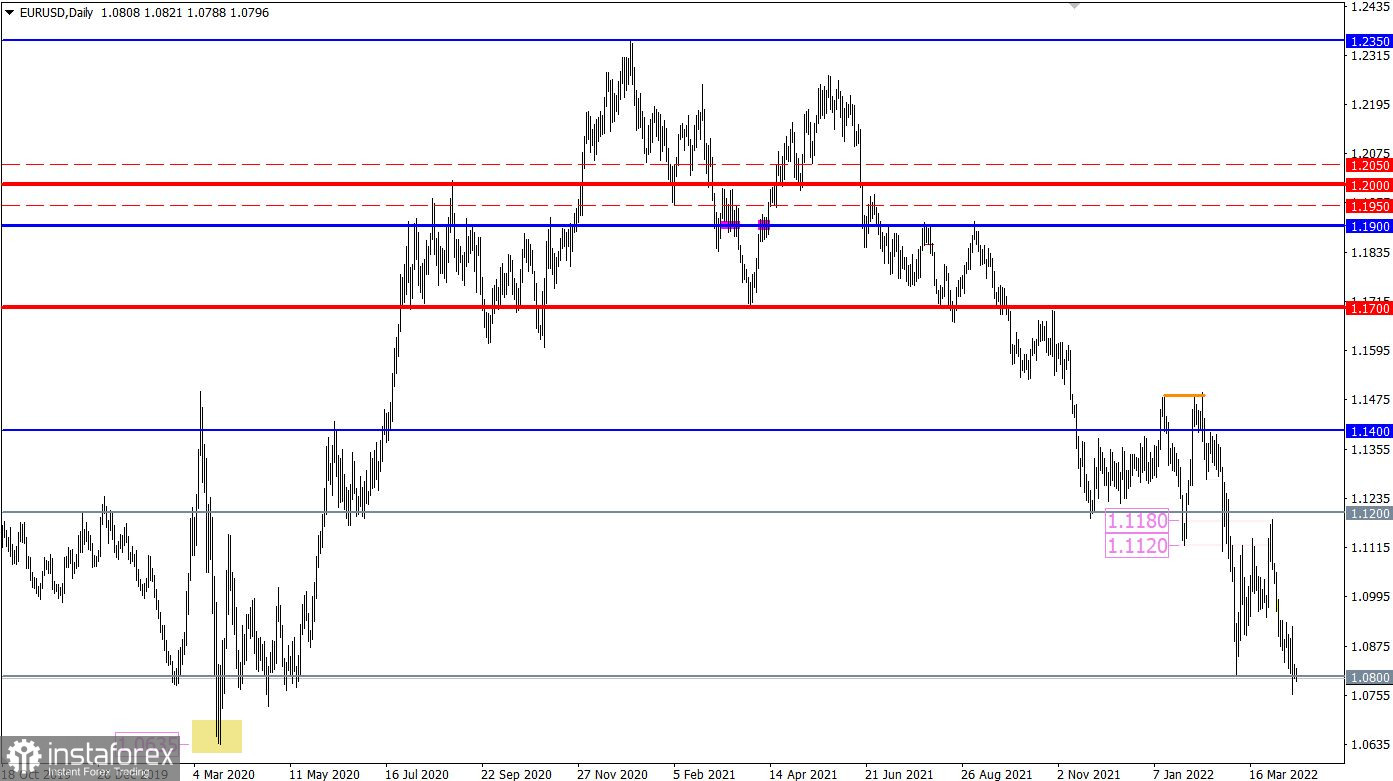
The EURUSD currency pair ended its stagnation within the support level of 1.0800 with its breakdown along a downward trajectory. This was a signal of prolongation of the medium-term downward trend.
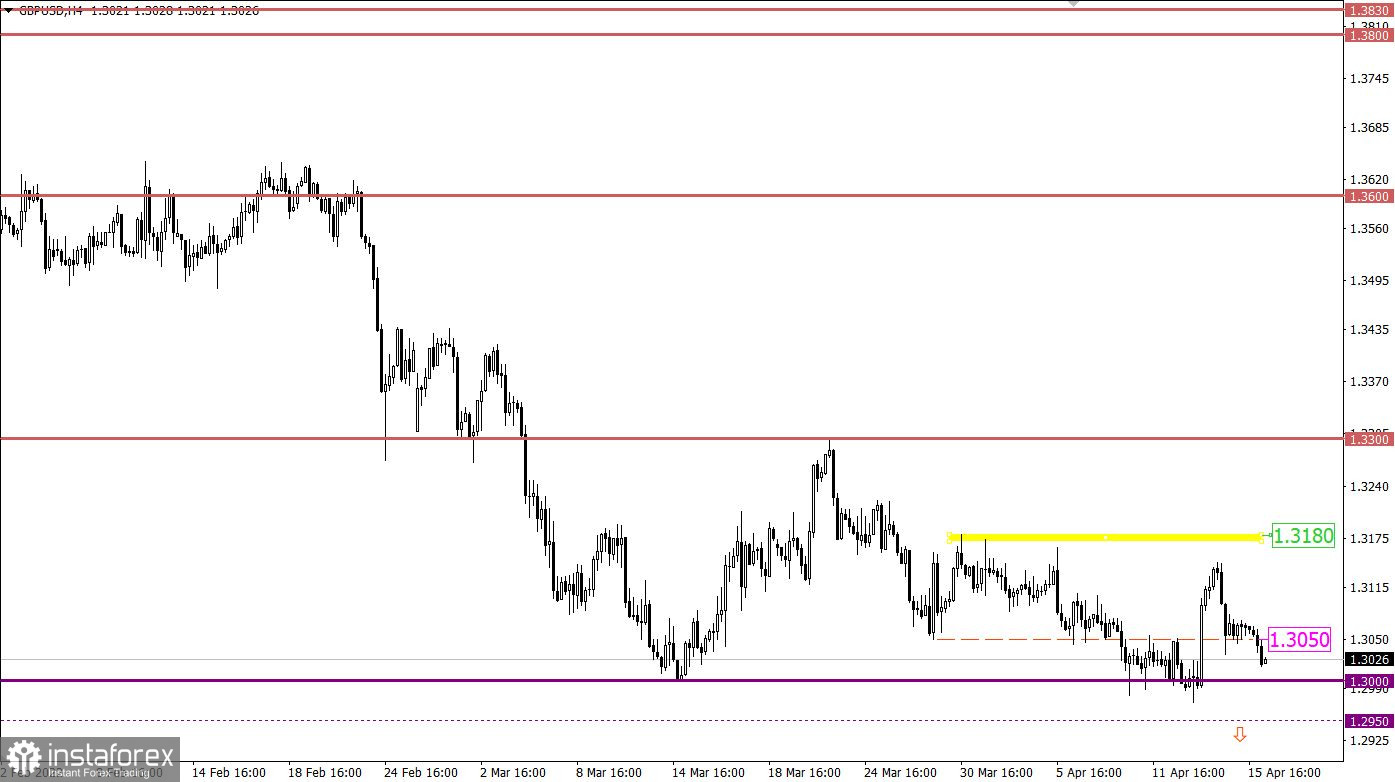
The GBPUSD currency pair, after a short stop near the value of 1.3050, rushed down towards the main support point of 1.3000. This indicates the prevailing downward interest among traders, where the medium-term trend will eventually be extended to new price levels.

Economic calendar for April 18
Today is a day off in Europe due to the celebration of Easter, so the financial sectors are not working. Thus, trading volumes may be reduced again, which will negatively affect volatility.
Trading plan for EUR/USD on April 18
Stable price retention below the support level of 1.0800 in a four-hour period increases the chances of sellers for a subsequent downward move. Traders consider the area of the local lows of 2020 at 1.0635/1.0660 as possible targets.
Trading plan for GBP/USD on April 18
At the time of writing, the quote is already moving within the psychological level of 1.3000, which indicates a complete recovery of short positions relative to the recent correction. The main signal to sell the pound sterling will come from the market when the price is kept below the value of 1.2950. In this case, the medium-term downward trend will be prolonged.
An alternative scenario of market development considers a local slowdown within the level of 1.3000, while the general downward mood will remain in the market. This step will only temporarily slow down sellers.
What is reflected in the trading charts?
A candlestick chart view is graphical rectangles of white and black light, with sticks on top and bottom. When analyzing each candle in detail, you will see its characteristics of a relative period: the opening price, closing price, and maximum and minimum prices.
Horizontal levels are price coordinates, relative to which a stop or a price reversal may occur. These levels are called support and resistance in the market.
Circles and rectangles are highlighted examples where the price of the story unfolded. This color selection indicates horizontal lines that may put pressure on the quote in the future.
The up/down arrows are the reference points of the possible price direction in the future.


