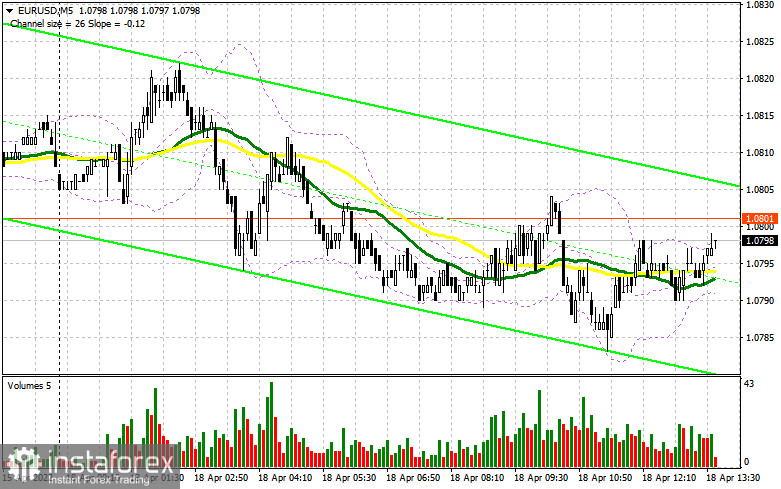
The euro/dollar pair is still trading in a narrow sideways channel, following the trend set on Friday. The volatility totals 20 pips. To this end, the price is unable to get close even to the nearest support and resistance levels. So, there are no entry points into the market. In the second half of the day, the pair is likely to move in the same range as it did in the morning. Taking into account technical indicators, there is no point in changing anything in the trading plan for the second half of the day.

What is needed to open long positions on EUR/USD:
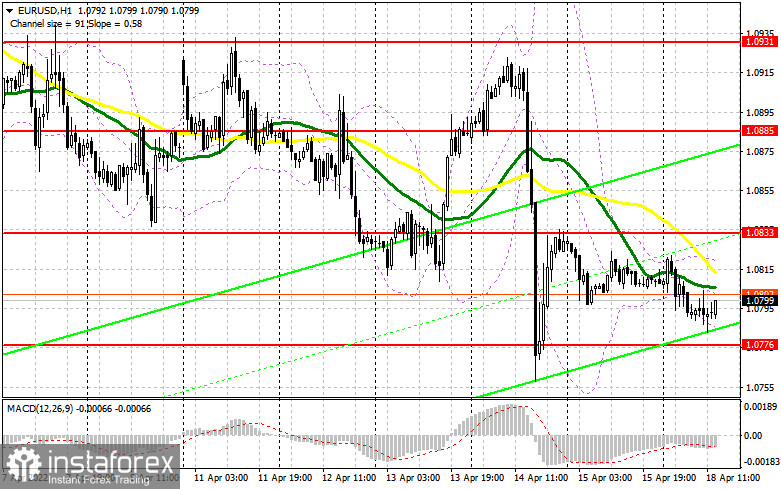
The macroeconomic calendar is empty for the eurozone amid the Easter holidays. As trading floors are closed, trading activity has been subdued in today's European session. In the second half of the say, there will be no crucial events as well. Therefore, it is better to refrain from active trading. Market participants are sure to take notice of the Nahb Housing Market Index and the speech of FOMC member James Bullard. He is highly likely to provide new hawkish comments on future monetary policy, namely rate hikes and other changes at the May meeting. If Bullard provides some new information, there might be a surge in volatility. however, such a scenario is rather unlikely. An upward correction could occur only if the price climbs above 1.0833. At this level, the moving averages are passing in the negative territory. A breakout and a downward test of this range will generate a buy signal. If so, the pair may return to 1.0885. If this scenario comes true, although it is quite unlikely, it will undermine the bears' stop orders. As a result, the pair will grow to the highs of 1.0931 and 1.0970 where I recommend profit-taking. In case of further decline, it is better to focus on the nearest support of 1.0776. Only a false breakout of this level will give a buy signal. If the pair falls and bulls show no activity at 1.0776, it is better to cancel long positions. The optimal scenario for purchases would be a false breakout near the new monthly low of 1.0728. It is possible to open long positions on the euro immediately for a rebound from 1.0636 or even a lower low around 1.0572, keeping in mind an upward intraday correction of 30-35 pips.
What is needed to open short positions on EUR/USD:
The bears stick to a wait-and-see approach, fueling the bearish momentum formed last Thursday. The primary task for today is the protection of the nearest resistance level of 1.0833. The future trajectory of the pair depends on this level. A false breakout of this will increase pressure on the pair. A sell signal could also appear with the likelihood of a further decrease within the trend to the support level of 1.0776. To sustain the bearish momentum, it is important to push the price to intraday swing lows. Until then, the pair is likely to trade flat. Only a breakout and an upward test of 1.0776 will give a sell signal. If so, the pair may drop to the lows of 1.0728 and 1.0636. I recommend profit-taking at these levels. The 1.0572 level will be a more distant target. The price may reach this level only amid the worsening of the geopolitical situation. If the euro rises in the second half of the day and bears show no energy at 1.0833, I expect a sharp upward movement of the euro. In this case, the optimal scenario will be short positions after a false breakout of 1.0885. It is recommended to sell EUR/USD immediately on a rebound from 1.0931 or even higher high near 1.0970, keeping in mind a downward intraday correction of 25-30 pips.

COT report
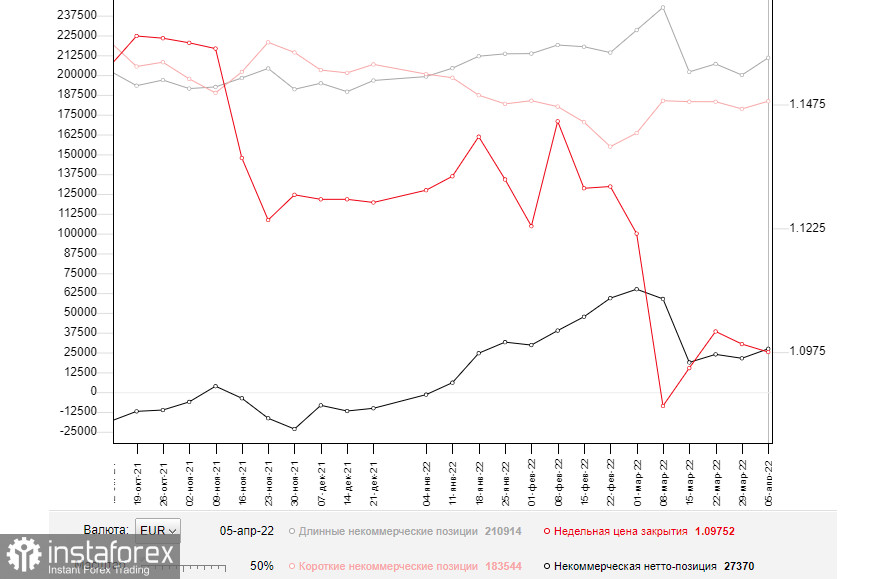
The COT report (Commitment of Traders) for April 5 logged an increase in both short and long positions. Notably, the number of long positions exceeded the number of shirt ones. Traders switched to long positions amid expectations of monetary policy tightening by the ECB. Besides, the regulator has also voiced the need to change the parameters of monetary policy. However, the absence of positive news on the negotiations between Russia and Ukraine and escalating geopolitical tensions continue to adversely affect the euro. As a result, the bulls are unable to resume an upward correction. In the near future, important data on the EU and the US will be published. The reports will provide more accurate figures on consumer price growth after the start of the Russian special military operation. It may also help policymakers make decisions on monetary policy, which will partially determine the further trajectory of the EUR/USD pair. The COT report revealed that the number of long non-commercial positions increased to 210,914 from 200,043, while the number of short non-commercial positions climbed to 183,544 from 178,669. Given that a rise in the volume of short positions turned out to be rather modest compared to long ones at the end of the week, the total non-commercial net position grew to 27,370 against 21,374. The weekly closing price dropped to 1.0976 from 1.0991.

Signals of technical indicators
Moving averages
EUR/USD is trading below 30- and 50-period moving averages. It means that the bears are ready to push the price to new lows.
Remark. The author is analyzing a period and prices of moving averages on the 1-hour chart. So, it differs from the common definition of classic daily moving averages on the daily chart.
Bollinger Bands
In case of a rise, the upper limit of the indicator around 1.0810 will act as resistance. A breakout of the lower limit of the indicator around of 1.0790 will cause a larger drop in the pair.
Definitions of technical indicators
- Moving average recognizes an ongoing trend through leveling out volatility and market noise. A 50-period moving average is plotted yellow on the chart.
- Moving average identifies an ongoing trend through leveling out volatility and market noise. A 30-period moving average is displayed as the green line.
- MACD indicator represents a relationship between two moving averages that is a ratio of Moving Average Convergence/Divergence. The MACD is calculated by subtracting the 26-period Exponential Moving Average (EMA) from the 12-period EMA. A 9-day EMA of the MACD called the "signal line".
- Bollinger Bands is a momentum indicator. The upper and lower bands are typically 2 standard deviations +/- from a 20-day simple moving average.
- Non-commercial traders - speculators such as retail traders, hedge funds and large institutions who use the futures market for speculative purposes and meet certain requirements.
- Non-commercial long positions represent the total long open position of non-commercial traders.
- Non-commercial short positions represent the total short open position of non-commercial traders.
- The overall non-commercial net position balance is the difference between short and long positions of non-commercial traders.


