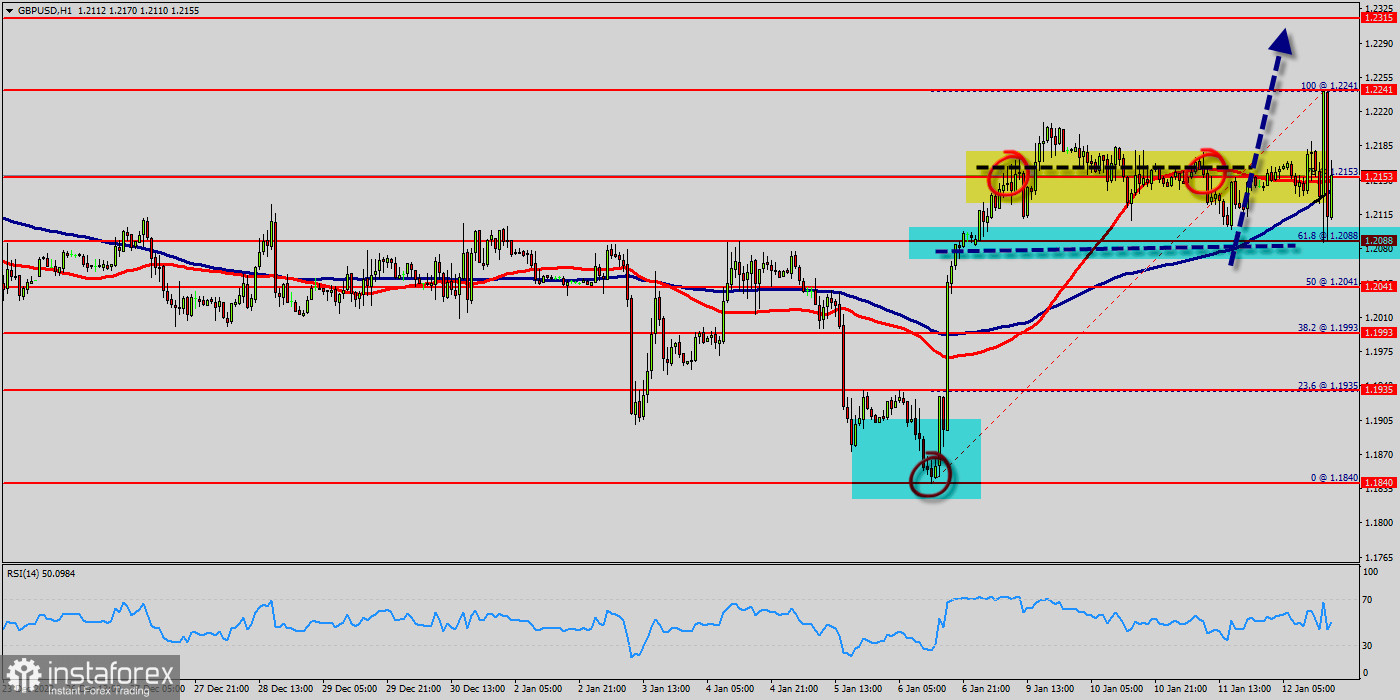
The GBP/USD pair hit the weekly pivot point and resistance 1, because of the series of relatively equal highs and equal lows. But the pair has risen in order to top at the point of 1.2088. Hence, the major resistance was already set at the level of 1.2241. Moreover, the double top is also coinciding with the major resistance this week.
Additionally, the RSI is still calling for a strong bullish market as well as the current price is also above the moving average 100. Therefore, it will be advantageous to buy above the support area of 1.2088 with the first target at 1.2241.
From this point, if the pair closes above the weekly pivot point of 1.2088, the GBP/USD pair may resume it movement to 1.2241 to test the weekly resistance 1.
Today, the GBP/USD pair has broken resistance at the level of 1.2088 which acts as support now.
Thus, the pair has already formed minor support at 1.2153. The strong support is seen at the level of 1.2088 because it represents the weekly support 1.
Equally important, the RSI and the moving average (100) are still calling for an uptrend. Therefore, the market indicates a bullish opportunity at the level of 1.2088 in the H1 chart.
Also, if the trend is buoyant, then the currency pair strength will be defined as following: GBP is in an uptrend and USD is in a downtrend. Buy above the minor support of 1.2088 with the first target at 1.2241 and continue towards 1.2315 (the weekly resistance 2).
However, be careful of excessive bullish movements. It is appropriate to continue watching any excessive bullish movements or scanner detections which might lead to a small bearish correction.
The GBP/USD pair traded higher and closed the day in positive territory near the price of 1.2153. Today it was trading in a narrow range of 1.2153 - 1.2315, staying close to yesterday's closing price.
The GBP/USD pair faced strong support at the level of 1.2088 because resistance became support. The strong support has been already faced at the level of 1.2088 and the pair is likely to try to approach it in order to test it again.
The level of 1.2088 represents a weekly pivot point for that it is acting as minor support this week. On the hourly chart, the GBP/USD pair broke through and fixed above the moving average line MA (100) H1 (1.2153).
The situation is similar on the four-hour chart. Based on the foregoing, it is probably worth sticking to the north direction in trading, and while the GBP/USD pair remains above MA 100 H1, it may be necessary to look for entry points to buy for the formation of a correction.
According to the previous events, the GBP/USD pair is still moving between the levels of 1.2153 and 1.2315; for that we expect a range of +162 pips in coming hours.
On the other hand, if the price closes below the minor support, the best location for the stop loss order is seen below 1.2315; for that, the price will fall into the bearish market in order to go further towards the strong support at 1.2088 to test it again.
Furthermore, the level of 1.2041 will form a double bottom. Stop loss should always be taken into account, accordingly, it will be of beneficial to set the stop loss below the last bottom at 1.2041.


