


Analysis of Tuesday's deals:
30M chart of the EUR/USD pair.
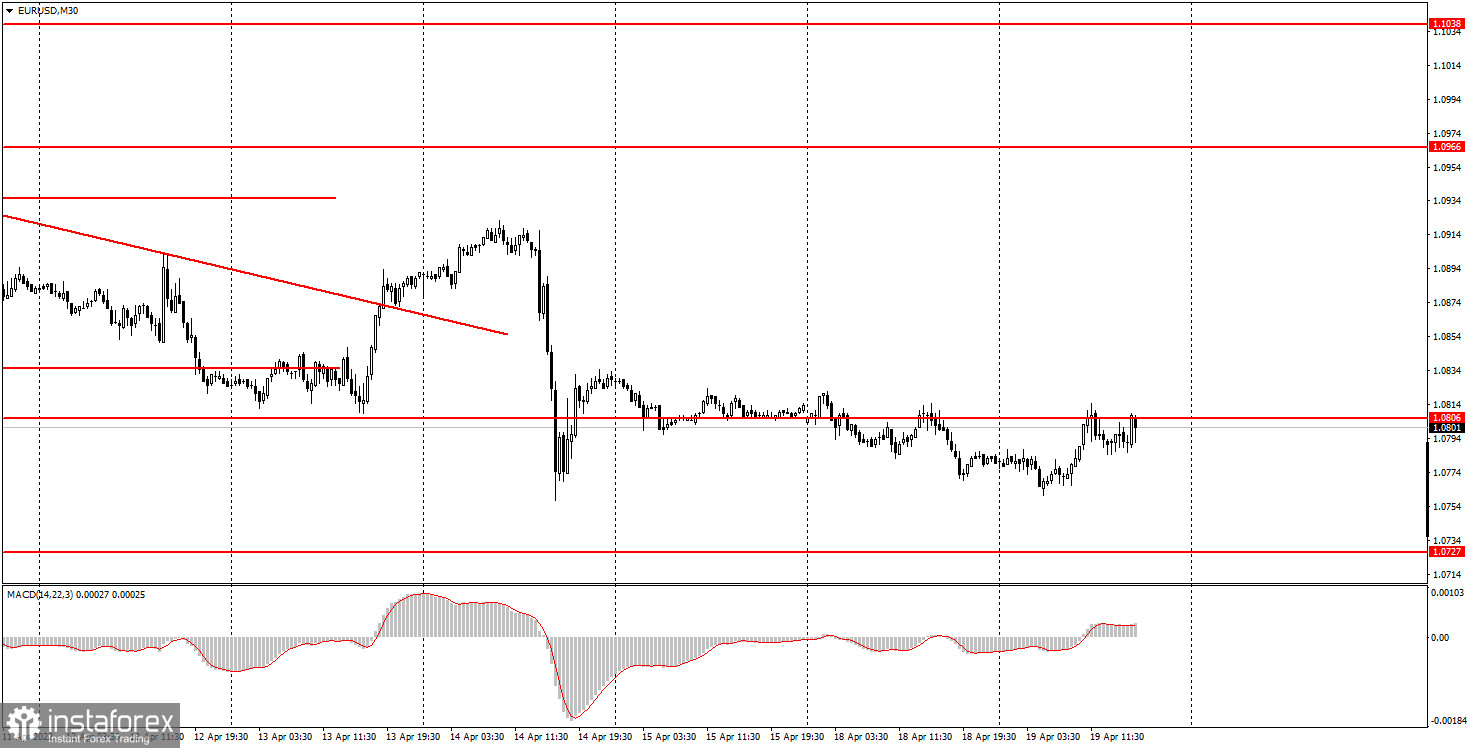
The EUR/USD currency pair on Tuesday once again failed to update its local lows, which were set on April 14. Although there is no doubt about the downward trend now, the entire downward movement in the last three trading days is very weak. That is, the following picture turns out: the downward movement is very weak, but at the same time very stable. On Tuesday, there was again not a single important macroeconomic or fundamental event in the United States and the European Union. Traders again had nothing to react to during the day. However, as we can see, this did not particularly affect their mood, because the euro/dollar pair continues to be located very low and with almost no chance of serious growth. Last night there was a speech by James Bullard, the head of the St. Louis Fed, who is considered the most important "hawk" within the Fed. He said that the key rate should be raised to 3.5% already in 2022, and the pace of rate increases at the next 6 meetings may be much higher than many expect now. Although these comments did not provoke a new growth of the dollar, they also do not allow buyers of the European currency to become more active. There is still no trend line or trend channel.
5M chart of the EUR/USD pair.
In the 5-minute timeframe, the technical picture has not changed since Friday and is "almost flat". Today, the pair managed to grow by 43 points in the European session, and in the American session, it failed to overcome the level of 1.0806 and began a new fall. However, 43 points are almost all of Tuesday's volatility. That is, this indicator remains very weak for the third day in a row. And with weak volatility and almost flat movement, it is extremely difficult to trade and earn. How can you make money if the couple is practically immobilized? However, two sell signals were published today. Both times the price bounced from the level of 1.0806, both times novice traders could open short positions. Since there was still some semblance of an intraday trend at the European session, it was possible to work out these signals. In the first case, the pair went down 12 points, in the second - not much more. Therefore, only one transaction had to be opened and at best it could be closed in a profit of about 10 points. In the worst case - in zero profit, since the pair could not leave above the level of 1.0806, therefore, the sell signal was not canceled.
How to trade on Wednesday:
On the 30-minute timeframe, the trend remains downward. It is still impossible to form either a trend line or a trend channel, so we can only blindly count on new falls of the pair. The euro continues to be very low, and there are simply no bulls on the market right now. Geopolitics and the "foundation" continue to be on the side of the US dollar, so we expect the pair to continue falling. On the 5-minute TF tomorrow, it is recommended to trade by levels 1.0727, 1.0758, 1.0806, 1.0837, 1.0905, and 1.0938. When passing 15 points in the right direction, you should set the Stop Loss to breakeven. On Wednesday, the European Union will publish a report on industrial production, which in the current circumstances is unlikely to provoke a market reaction. In the States, tomorrow, the publication of the Fed's economic review "Beige Book" is late in the evening. In any case, it will not affect trading during the day.
Basic rules of the trading system:
1) The strength of the signal is calculated by the time it took to generate the signal (rebound or overcome the level). The less time it took, the stronger the signal.
2) If two or more trades were opened near a certain level on false signals, then all subsequent signals from this level should be ignored.
3) In a flat, any pair can form a lot of false signals or not form them at all. But in any case, at the first signs of a flat, it is better to stop trading.
4) Trade transactions are opened in the period between the beginning of the European session and the middle of the American session when all transactions must be closed manually.
5) On a 30-minute TF, signals from the MACD indicator can be traded only if there is good volatility and a trend, which is confirmed by a trend line or a trend channel.
6) If two levels are located too close to each other (from 5 to 15 points), then they should be considered as a support or resistance area.
What's on the charts:
Price support and resistance levels - the levels that are the targets when opening purchases or sales. Take Profit levels can be placed near them.
Red lines - channels or trend lines that display the current trend and show in which direction it is preferable to trade now.
MACD indicator (14, 22, 3) - a histogram and a signal line - an auxiliary indicator that can also be used as a signal source.
Important speeches and reports (always contained in the news calendar) can greatly influence the movement of a currency pair. Therefore, during their exit, it is recommended to trade as carefully as possible or exit the market to avoid a sharp price reversal against the previous movement.
Forex beginners should remember that every trade cannot be profitable. The development of a clear strategy and money management are the keys to success in trading over a long period.


