Details of the economic calendar from April 19
The US construction sector data showed growth instead of the predicted decline. So, it was expected that all indicators, without exception, would fall in the period of March, but that was not the case. New housing starts increased by 0.3%, while the number of building permits issued increased by 0.4%.
Positive statistics only temporarily strengthened dollar positions. Most of the time the quote stood still during the past day.
Analysis of trading charts from April 19
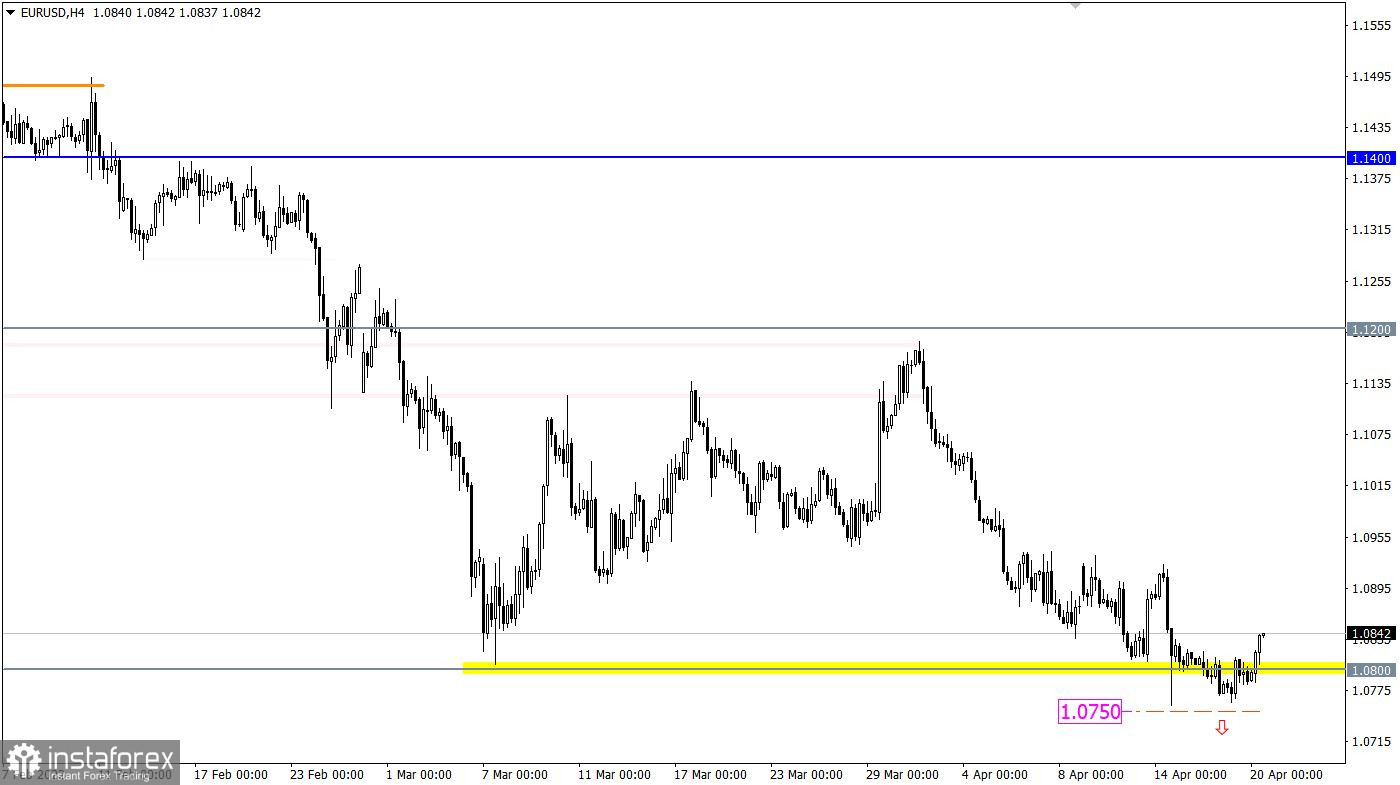
The EURUSD currency pair has a slight pullback from the 1.0800 support area. With all this movement, the downward cycle, as before, is considered by traders as the main move in the medium term.
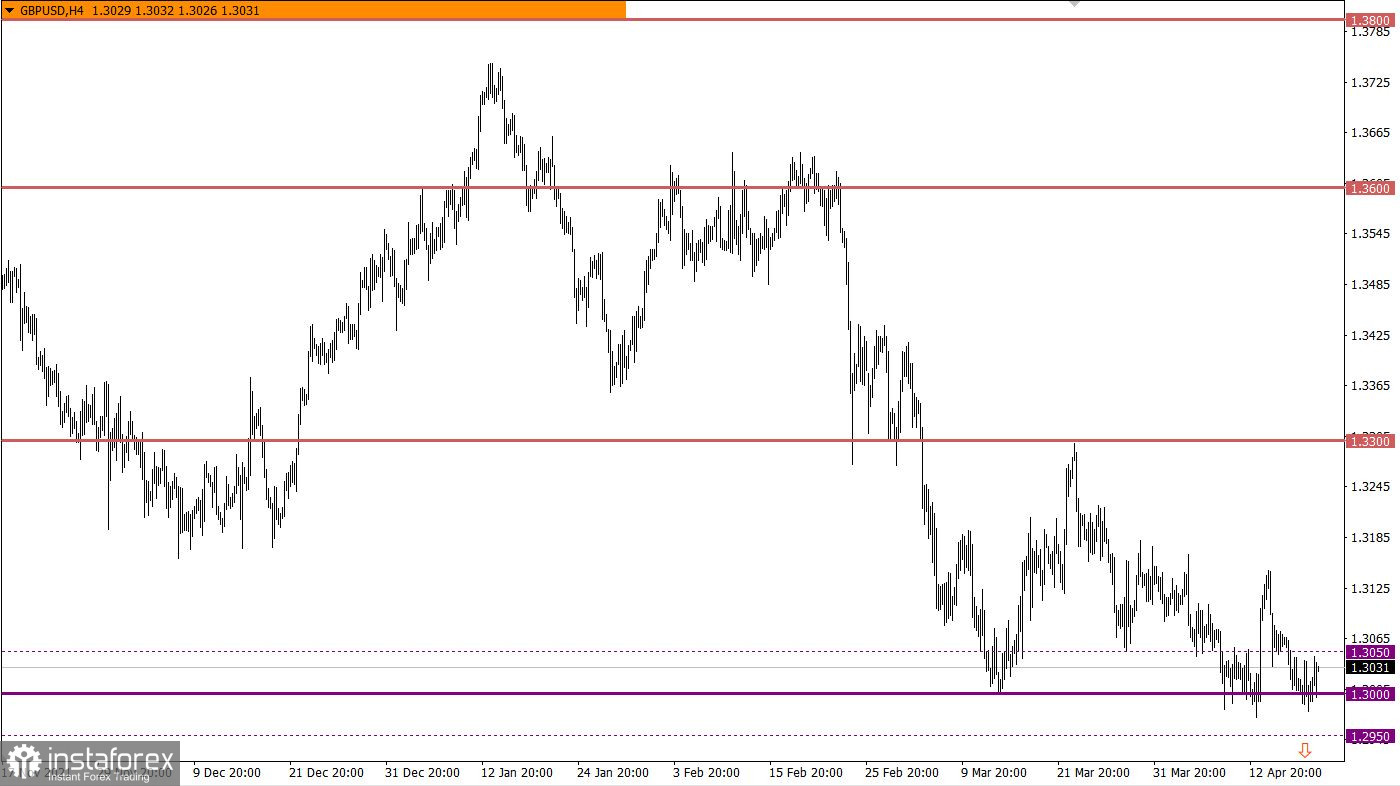
The GBPUSD currency pair has been moving along the 1.3000 support level for several days in a row. This movement indicates the characteristic uncertainty of market participants who are on the verge of prolongation of the medium-term downward trend.

Economic calendar for April 20
Today at 09:00 UTC, data on industrial production in Europe were published, where a decline of 1.5% was replaced by an increase of 2.0%. It is worth considering that these data were for February, and they are no longer relevant due to the current situation in the world. The March figures will definitely be worse.
During the American trading session, data on existing home sales in the United States for March will be published, where they predict a decline in the indicator. This is a negative indicator for the US real estate market, but it will put little pressure on the dollar.
Time targeting
US Existing Home Sales - 12:00 UTC
Trading plan for EUR/USD on April 20
Despite the breakdown of the support level, traders still need to get confirmation from the market. A sell signal will be taken into account at the moment the price is kept below 1.0750. Until then, the stagnation-pullback will continue in the market.

Trading plan for GBP/USD on April 20
In this situation, the stagnation within the psychological level of 1.3000 changed to a local pullback. This movement does not break the clock component of the downward trend. The signal to sell the pound sterling and prolong the medium-term trend will be received when the price holds below 1.2950 in a four-hour period.

What is reflected in the trading charts?
A candlestick chart view is graphical rectangles of white and black light, with sticks on top and bottom. When analyzing each candle in detail, you will see its characteristics of a relative period: the opening price, closing price, and maximum and minimum prices.
Horizontal levels are price coordinates, relative to which a stop or a price reversal may occur. These levels are called support and resistance in the market.
Circles and rectangles are highlighted examples where the price of the story unfolded. This color selection indicates horizontal lines that may put pressure on the quote in the future.
The up/down arrows are the reference points of the possible price direction in the future.


