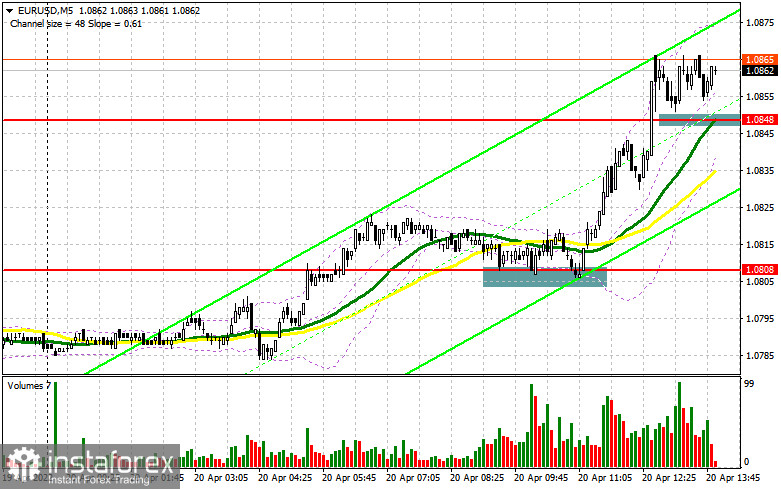
In the morning article, I highlighted the level of 1.0808 and recommended taking decisions with this level in focus. Now let's look at the 5-minute chart and try to figure out what actually happened. After the decline of the euro to this level, an excellent bug signal appeared within a bullish correction during the Asian session. Germany's upbeat economic reports boosted the price to 1.0848. The breakout of this level occurred quite soon. However, there was no downward test from this level. We lacked just several pips to open new long positions. As a result, the pair has already risen by more than 60 pips from the entry point. Demand for the euro remains high.

What is needed to open long positions on EUR/USD
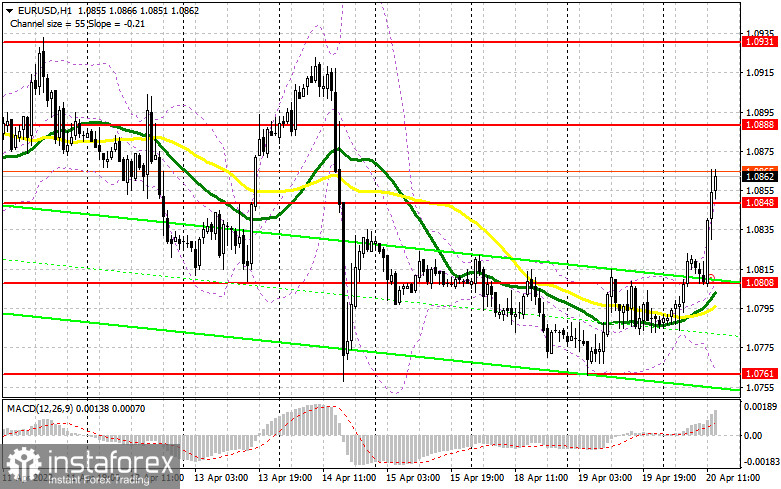
In the second half of the day, several FOMC members are going to deliver their speeches. Their comments may slow down the upward movement of the euro. The pressure on the pair may also return again. The main task of the bulls is to keep the pair above the 1.0848 level. If the price dips below this level, traders will lock in profit. It will only increase the pressure on EUR/USD. During the American session, data on existing home sales in the US is due. However, investors will mainly focus on the speeches of FOMC members Mary Daly and Charles Evans. They will certainly speak about interest rate increases to curb soaring inflation. Consumer prices are expected to hit 9.0%. Therefore, in the case of a decline in the euro, a false breakout at 1.0848, similar to the one I mentioned above, will generate a buy signal within the upward correction. The target level will be 1.0888. A breakout and a downward test of this level as well as weak US data will give an additional signal to open long positions. If so, the pair may rise to 1.0931. A more distant target will be 1.0970 where I recommend profit-taking. However, the aggravation of the geopolitical conflict and Russia's more active military actions in Ukraine after the failed negotiations will restrain demand for risky assets. The ongoing upward movement can end quickly at any moment, so it is better to place stop orders. The euro will become even more attractive for sellers if it grows higher. Besides, many traders are betting on further strengthening of the US dollar amid expectations of rate hikes by the Fed in May. Some economists do not exclude even a 0.75% increase. If EUR/USD declines in the afternoon and bulls show no activity at 1.0848, it is better to cancel long positions. The optimal scenario for opening long positions would be a false breakout at 1.0808. Today, the bulls managed to defend this level. It is also possible to open long positions on the euro immediately for a rebound only from 1.0761 or even a lower low around 1.0723, keeping in mind an upward intraday correction of 30-35 pips.
What is needed to open short positions on EUR/USD
Sellers tried to regain control but their attempts were not crowned with success. Now, the primary task for today is to protect the nearest resistance level of 1.0888. The bulls targeted this level in the first half of the day. This level is extremely important as its breakout will determine whether the growth of the pair will continue or it will lose the steam. Only a false breakout of this level and weak US data will give a sell signal with a downward target near the support level of 1.0848. Bears failed to take control over this level today. To cement the downward movement, they need to push the pair below this level. An upward test of this level will cause a new sell-off of the euro. The price is sure 1.0808. The distant lows are located at 1.0761 and 1.0723 where I recommend profit-taking. If the euro rises in the afternoon and bears show no energy1.0888, a sharper jump in the pair is likely to occur. In this case, it is recommended to open short positions after a false breakout of 1.0931. You can sell EUR/USD immediately for a rebound from 1.0970 or even a higher high around 1.1007, keeping in mind a downward intraday correction of 25-30 pips.

COT report
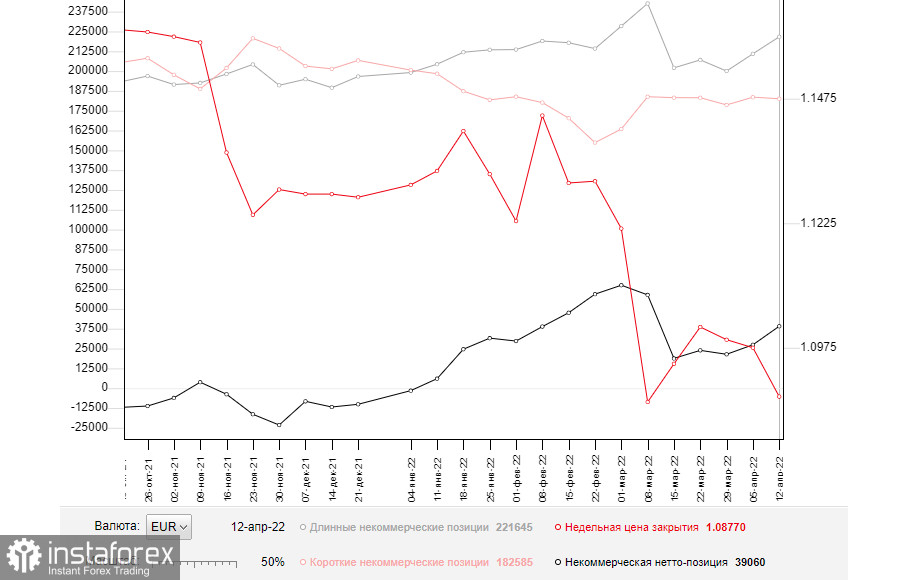
The COT report (Commitment of Traders) for April 12 logged a sharp increase in long positions and a small drop in short ones. Such a change reflects expectations that the ECB will take a more aggressive stance on monetary policy to cap rising inflation. Christine Lagarde announced such a possibility last week. The ECB plans to fully complete the bond purchase program by the third quarter of this year and start raising the interest. It indicates that the regulator plans to combat high inflation in the eurozone, which adversely affects household incomes. Notably, many countries are ow coping with such a problem. The previous week's report unveiled that the US consumer price index approached a four-decade high. This fact may force the Fed to take even more radical measures. At the May meeting, the regulator may hike the interest rate by 0.5%. Against this backdrop, demand for the US dollar remains high, thus pushing the euro/dollar pair lower. The euro is also unable to rise due to the Russia-Ukraine conflict and the lack of progress in the negotiations. The COT report revealed that the number of long non-commercial positions grew to 221,645 from 210,914, while the number of short non-commercial positions declined to 182,585 from 183,544. Although the number of long positions jumped, remember that the COT report is of little importance since the market situation changes rapidly. In other words, these figures do not reflect the real market situation. However, a drop in the euro makes it more attractive for investors. That is why a jump in long positions was quite expectable. According to the previous week's results, the total non-commercial net position rose to 39,060 from 27,370. The weekly closing price slid down by almost 100 pips to 1.0877 from 1.0976.

Signals of technical indicators
Moving averages
EUR/USD is trading above 30- and 50-period moving averages. It means that the bulls don't give up attempts to carry on with an upward correction.
Remark. The author is analyzing a period and prices of moving averages on the 1-hour chart. So, it differs from the common definition of classic daily moving averages on the daily chart.
Bollinger Bands
In case of a decline, the lower border of the indicator around 1.0761 will act as support.
Definitions of technical indicators
- Moving average recognizes an ongoing trend through leveling out volatility and market noise. A 50-period moving average is plotted yellow on the chart.
- Moving average identifies an ongoing trend through leveling out volatility and market noise. A 30-period moving average is displayed as the green line.
- MACD indicator represents a relationship between two moving averages that is a ratio of Moving Average Convergence/Divergence. The MACD is calculated by subtracting the 26-period Exponential Moving Average (EMA) from the 12-period EMA. A 9-day EMA of the MACD called the "signal line".
- Bollinger Bands is a momentum indicator. The upper and lower bands are typically 2 standard deviations +/- from a 20-day simple moving average.
- Non-commercial traders - speculators such as retail traders, hedge funds and large institutions who use the futures market for speculative purposes and meet certain requirements.
- Non-commercial long positions represent the total long open position of non-commercial traders.
- Non-commercial short positions represent the total short open position of non-commercial traders.
- The overall non-commercial net position balance is the difference between short and long positions of non-commercial traders.


