


Details of the economic calendar from April 22
Retail sales in the UK collapsed from 7.2% to 0.9%. This is an extremely negative factor for the British economy, which immediately affected the value of the British currency. The negative for Britain did not end there, a little later data on business activity were published, where the service sector index fell from 62.6 points to 58.3 points. With a forecast of 58.9 points. The index of business activity in the manufacturing sector remained at the same level, while the composite index decreased from 60.9 points to 57.6 points. As a result, the pound sterling accelerated its decline.
In Europe, the index of business activity came out better than expected. In the service sector, there is an increase in the index from 55.6 points to 57.7 points, while the forecast is 55.0 points. The index of business activity in the manufacturing sector fell from 56.5 points to 55.3 points, but a decline to 54.7 points was expected. The composite index rose from 54.9 points to 55.8 points.
During the publication of data on the EU, the euro strengthened locally in value.
The business activity index in the United States showed an increase in the manufacturing sector from 58.8 points to 59.7 points. The service sector index, on the contrary, fell from 58.0 points to 54.7 points. As a result, the composite index fell from 57.7 points to 55.1 points.
Despite the not-so-good data on the US, the dollar continued to strengthen.
Analysis of trading charts from April 22
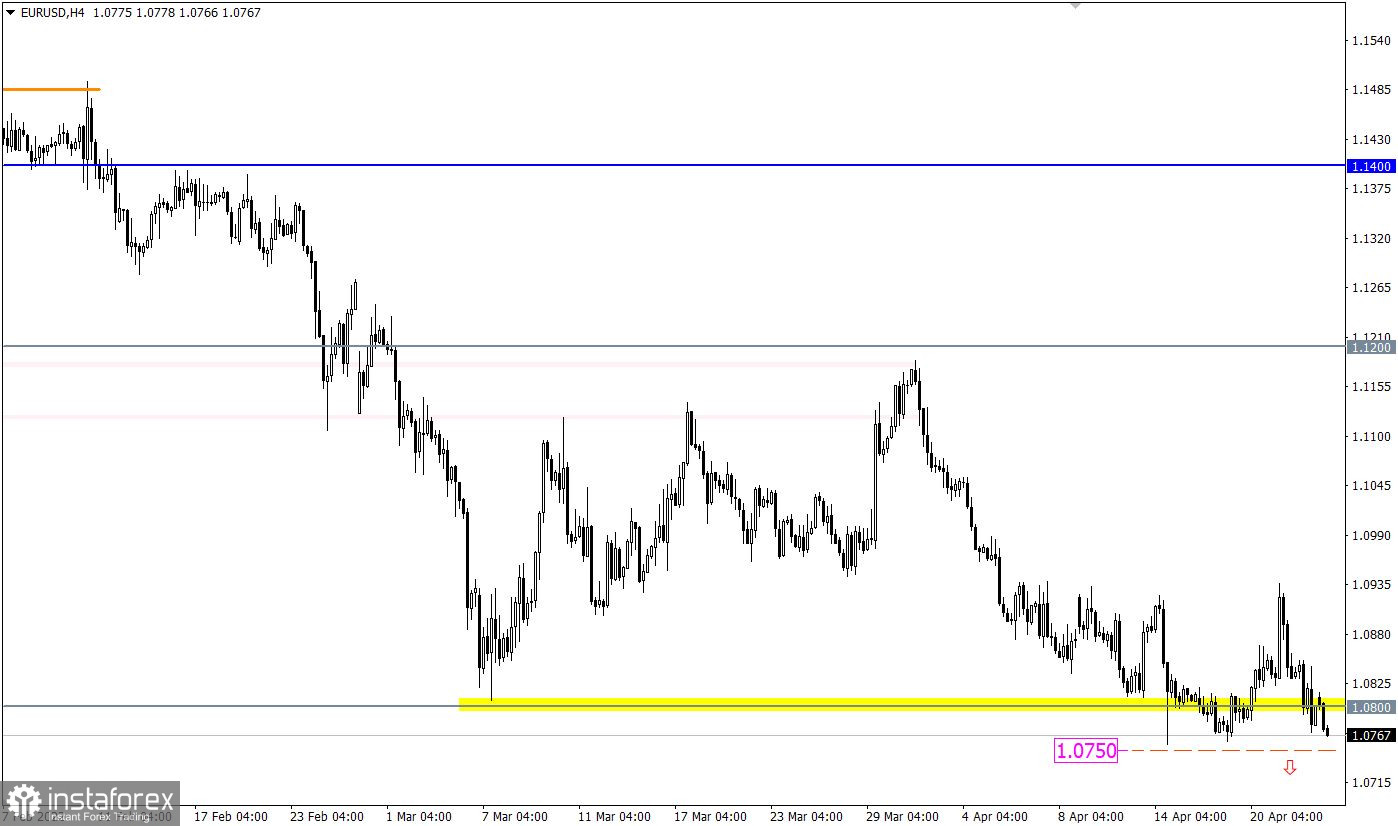
The EURUSD currency pair is consistently increasing the volume of short positions, as indicated by the price consolidation below the level of 1.0800. There was no signal for the prolongation of the medium-term downward trend during the past week.
The daily trading chart shows a gradual weakening of the euro since June 2021. The scale of the decline is 1,450 points, which is about 12%.
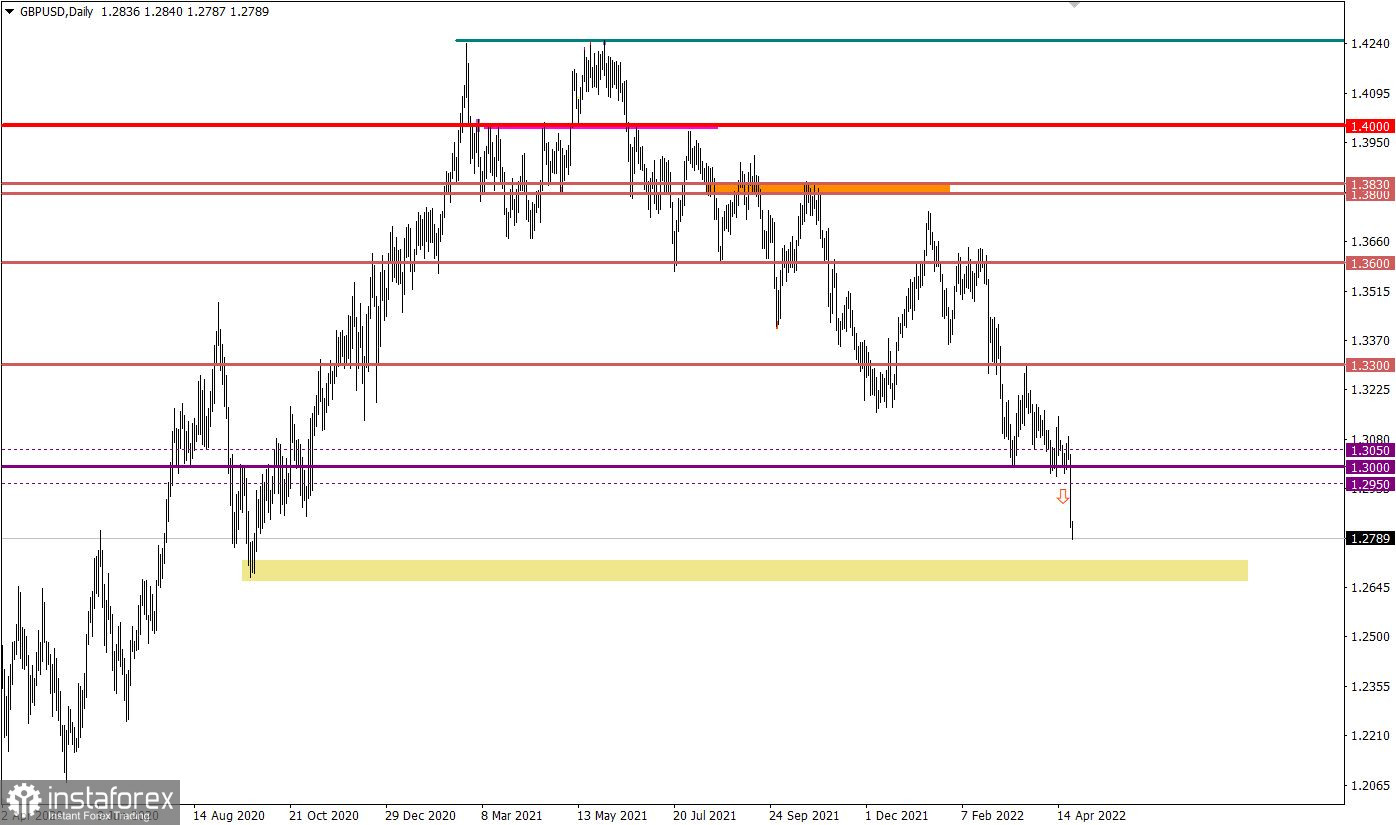
The GBPUSD currency pair broke through the psychologically important level of 1.3000 in a downward trajectory. This led to a continuation of the downward trend, where the pound lost about 200 pips in value in 24 hours.
The daily trading chart shows a gradual weakening of the pound sterling since June 2021. The scale of the decline is 1,400 points, which is about 10%.
Economic calendar for April 25
Monday is traditionally accompanied by an empty macroeconomic calendar. Nevertheless, stable information and news flow will continue to play on the nerves of speculators, which allows for new jumps in the market.
Trading plan for EUR/USD on April 25
The first signal to sell the euro was received from the market when the price was kept below 1.0800. In order to confirm the intentions of the sellers, the quote needs to stay below the value of 1.0750 in a four-hour period. In this case, the euro exchange rate may decrease in the direction of the local low on March 23, 2020, at 1.0636. Until then, variable fluctuation along the level of 1.0800 is possible.
Trading plan for GBP/USD on April 25
The market is currently moving in a downward trend, which is expected to last for some time. Despite the main movement, the market has two cycles – momentum and correction. Thus, the current impulse will sooner or later move into a correction stage, which is indicated by the euro's oversold status. The area of the local low of September 2020 at 1.2675/1.2720 can become a variable support.
What is reflected in the trading charts?
A candlestick chart view is graphical rectangles of white and black light, with sticks on top and bottom. When analyzing each candle in detail, you will see its characteristics of a relative period: the opening price, closing price, and maximum and minimum prices.
Horizontal levels are price coordinates, relative to which a stop or a price reversal may occur. These levels are called support and resistance in the market.
Circles and rectangles are highlighted examples where the price of the story unfolded. This color selection indicates horizontal lines that may put pressure on the quote in the future.
The up/down arrows are the reference points of the possible price direction in the future.


