It is time to take a look at the rather curious and much-loved pair of the two North American dollar currencies. As the market was closing weekly trading on Friday, let's start the technical analysis of the USD/CAD from the weekly timeframe and see if there were any important changes.
Weekly
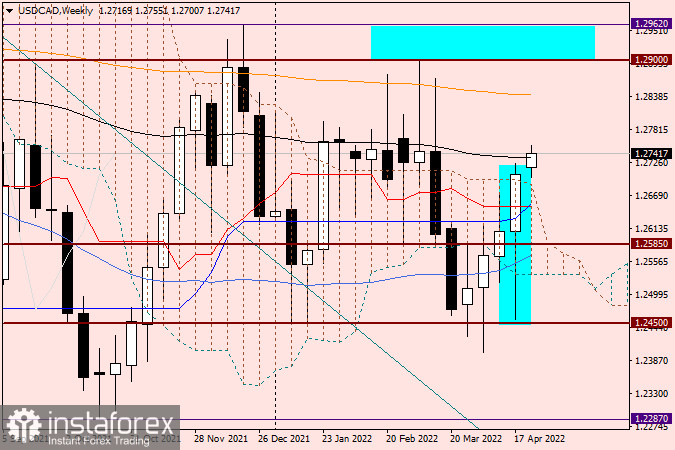
The changes have taken place, and we are now going to outline them. First of all, I recommend you to pay attention to the shape of the last weekly highlighted candlestick. The very long bottom shadow of this candlestick and its final bullish body with the closing price above the upper boundary of the weekly Ichimoku cloud clearly demonstrate the strength of bullish sentiment in USD/CAD. Although the start of trading did not at all portend what happened in the end. Bears on USD/CAD, it would seem, confidently kept an eye on the ball and fully controlled the course of trading, until the meeting with strong technical level 1.2450. If you remember, this level was mentioned several times in previous reviews for this trading instrument. And now the time has come to show it in all its glory.
As you can see, from 1.2450 there was a dramatic reversal in the Canadian dollar trading. The second thing to look out for is the upward exit from the Ichimoku cloud and the closing of the weekly session above its upper boundary. The start of trading of the current five-day period is again for the bulls in USD/Cad. At the time of writing, the pair is testing the black 89-exponential moving average, a break-up of which would further strengthen the bullish sentiment of the pair. If the bears manage to end the trading of the current five-day in their favor and close the week within the cloud, it will be something to think about. In the meantime, the pair is clearly looking up, and after it might cross the 89 EMA, it will go towards the orange 200 EMA, which is at 1.2841.
Daily
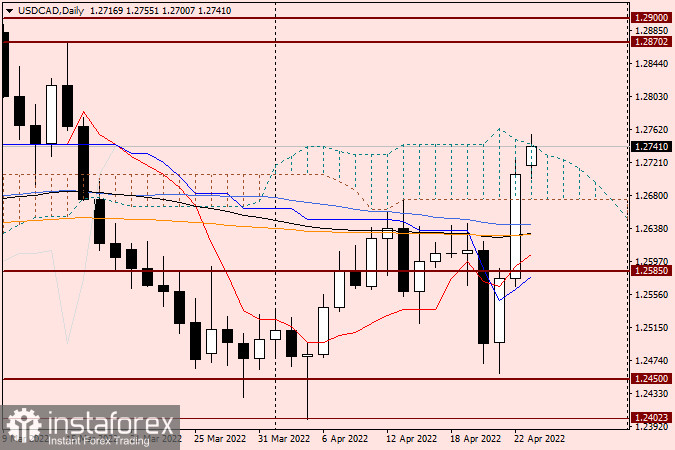
The daily chart clearly shows that momentum players are trying to push the price up out of the daily Ichimoku cloud. If these attempts are successful and the pair consolidates above the upper boundary of the cloud, a pullback to the upper boundary could be used to open long positions with potential targets in the 1.2870-1.2900 area. As you can see, at 1.2900 there is a strong resistance of the sellers, which can be reasonably considered as a key resistance. However, we should not forget about another important psychological, historical and technical level, 1.3000. This mark has repeatedly made a difference to the USD/CAD price trend. However, the way to the 30th figure is still a long way off and needs to be overcome. Let's see how the bulls on the instrument will be able to keep control of the trading in their hands. In the meantime, the main trading recommendation for USD/CAD is buying, which is better to plan after the downward correction pullbacks. I consider the price area of 1.2635-1.2600 as a benchmark for opening long positions. If the pullback to the specified price zone does not take place, after consolidation above the upper limit of the daily cloud, on a rollback to it, you can also plan to open buy positions. For the sales I recommend to wait for clear reversal candlestick signals on the daily chart.


