


Analyzing trades on Monday:
EUR/USD on 30M chart
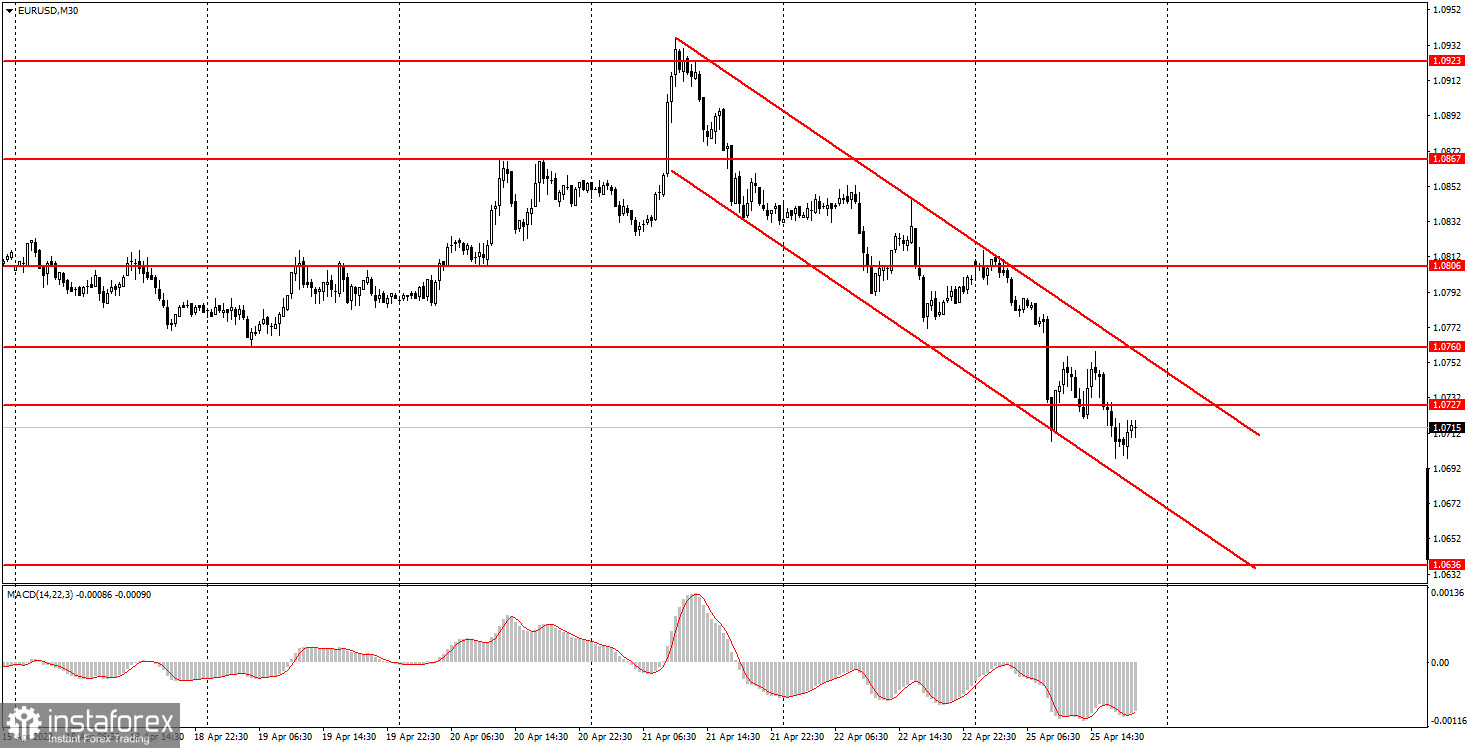
EUR/USD continued its downward movement on Monday from the very start of the session. Obviously, if the price starts falling at night, this movement could not be triggered by any macroeconomic or fundamental events. There were no reports or publications on weekends. However, a strong fall of the European currency began on Friday, or rather, on Thursday. This was the day when ECB Vice President Luis de Guindos announced a possible rate hike in July 2022. It was after this news that the euro showed considerable growth and then declined at a rapid pace. It becomes clear that all efforts of the market were aimed at overcoming the level of 1.0760, a 15-month low of the pair. Therefore, there are several factors to blame for the current fall of the euro. It is unlikely that speeches by de Guindos and Lagarde could have sent the euro tumbling by 230 pips. As for today, it seems that the fall continued without any reason. There were neither macroeconomic nor fundamental events during the day. The euro is simply declining given all the factors that we have repeatedly listed.
EUR/USD on 5M chart
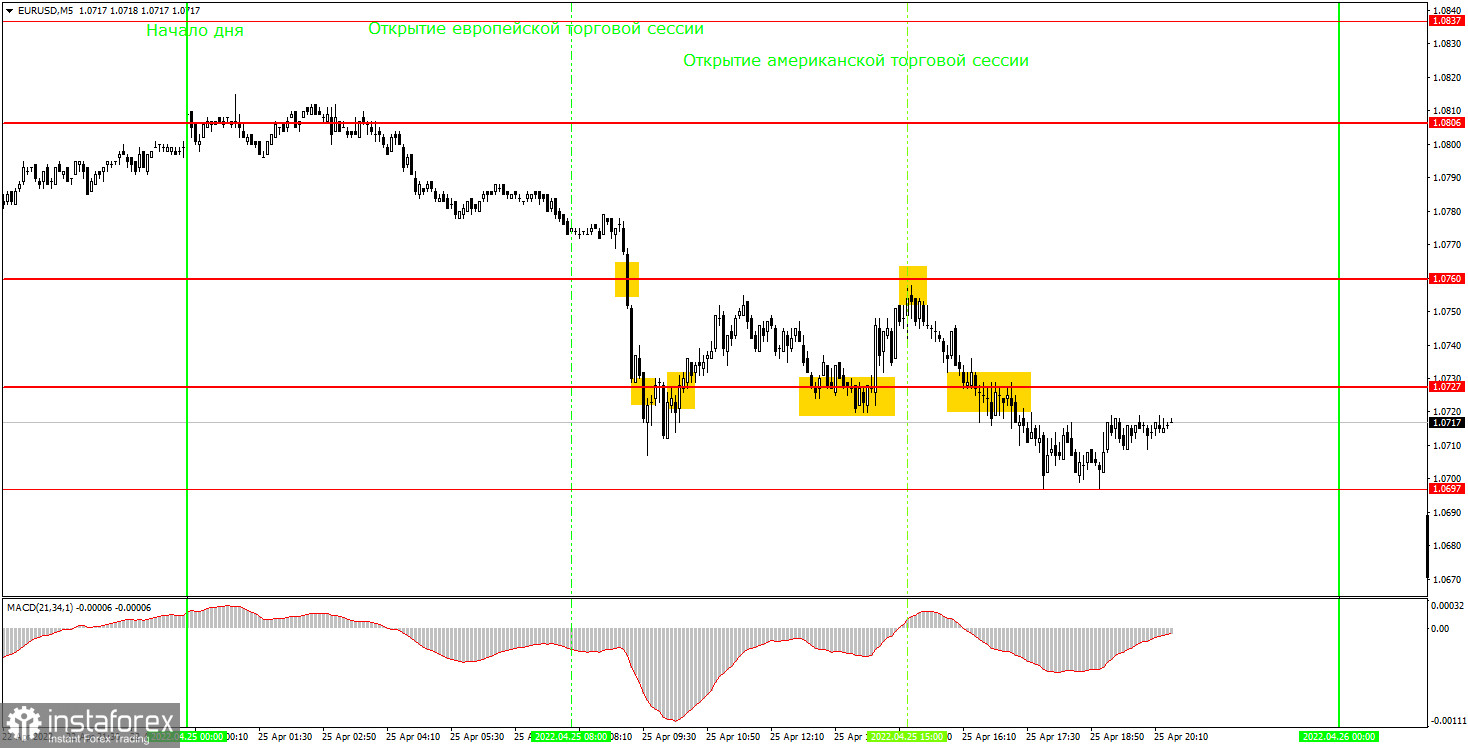
On the 5-minute time frame, the technical picture looks mixed. The first sell signal was formed when the price broke through the level of 1.0760. Naturally, it was necessary to follow this signal. The pair subsequently fell below the level of 1.0727 but returned above this level an hour later. Therefore, a sell trade had to be closed with a profit of 15 pips and new long positions had to be opened. However, these buy trades did not bring any profit to traders as the price managed to go up by only 18 pips. However, this was enough to set a Stop Loss to breakeven which was triggered when the pair returned to the level of 1.0727. A rebound from this level was a new buy signal, which should also have been followed. This time the pair rose almost to the level of 1.0760 (2 pips discrepancy) and rebounded from it. Therefore, at this moment, long positions should have been closed with a profit of few pips and new short positions should have been opened. The last sell trade was the most profitable one as the pair went down by almost 50 pips. The trade had to be closed manually with a profit of 30 pips in the late afternoon.
Trading tips on Tuesday
On the 30-minute time frame, the downtrend remains in place, which is especially evident on the higher time frames. On the 30-minute time frame, the movement took too long to develop. So, on this chart above, it is difficult to see the real scope of the downward movement. However, traders continue to sell the euro, which is not surprising. On the 5-minute chart on Tuesday, it is recommended to trade at the levels of 1.0636, 1.0697, 1.0727, 1.0760, 1.0806, 1.0837, and 1.0867. You should set a Stop Loss to breakeven as soon as the price passes 15 pips in the right direction. There are no important publications or events scheduled in the EU on Tuesday. Relatively important reports on durable goods orders and consumer confidence index will be released in the US. There may be some market reaction to these reports, but at the moment, the pair is very volatile even though there is no macroeconomic data.
Basic rules of the trading system
1) The strength of the signal is determined by the time it took the signal to form (a rebound or a breakout of the level). The quicker it is formed, the stronger the signal is.
2) If two or more positions were opened near a certain level based on a false signal (which did not trigger a Take Profit or test the nearest target level), then all subsequent signals at this level should be ignored.
3) When trading flat, a pair can form multiple false signals or not form them at all. In any case, it is better to stop trading at the first sign of a flat movement.
4) Trades should be opened in the period between the start of the European session and the middle of the US trading hours, when all positions must be closed manually.
5) You can trade using signals from the MACD indicator on the 30-minute time frame only amid strong volatility and a clear trend that should be confirmed by a trendline or a trend channel.
6) If two levels are located too close to each other (from 5 to 15 pips), they should be considered support and resistance levels.
On the chart
Support and Resistance Levels are the levels that serve as targets when buying or selling the pair. You can place Take Profit near these levels.
Red lines are channels or trend lines that display the current trend and show in which direction it is better to trade now.
The MACD indicator (14, 22, and 3) consists of a histogram and a signal line. When they cross, this is a signal to enter the market. It is recommended to use this indicator in combination with trend patterns (channels and trendlines).
Important announcements and economic reports that can be found on the economic calendar can seriously influence the trajectory of a currency pair. Therefore, at the time of their release, we recommend trading as carefully as possible or exiting the market in order to avoid sharp price fluctuations.
Beginners on Forex should remember that not every single trade has to be profitable. The development of a clear strategy and money management is the key to success in trading over a long period of time.


