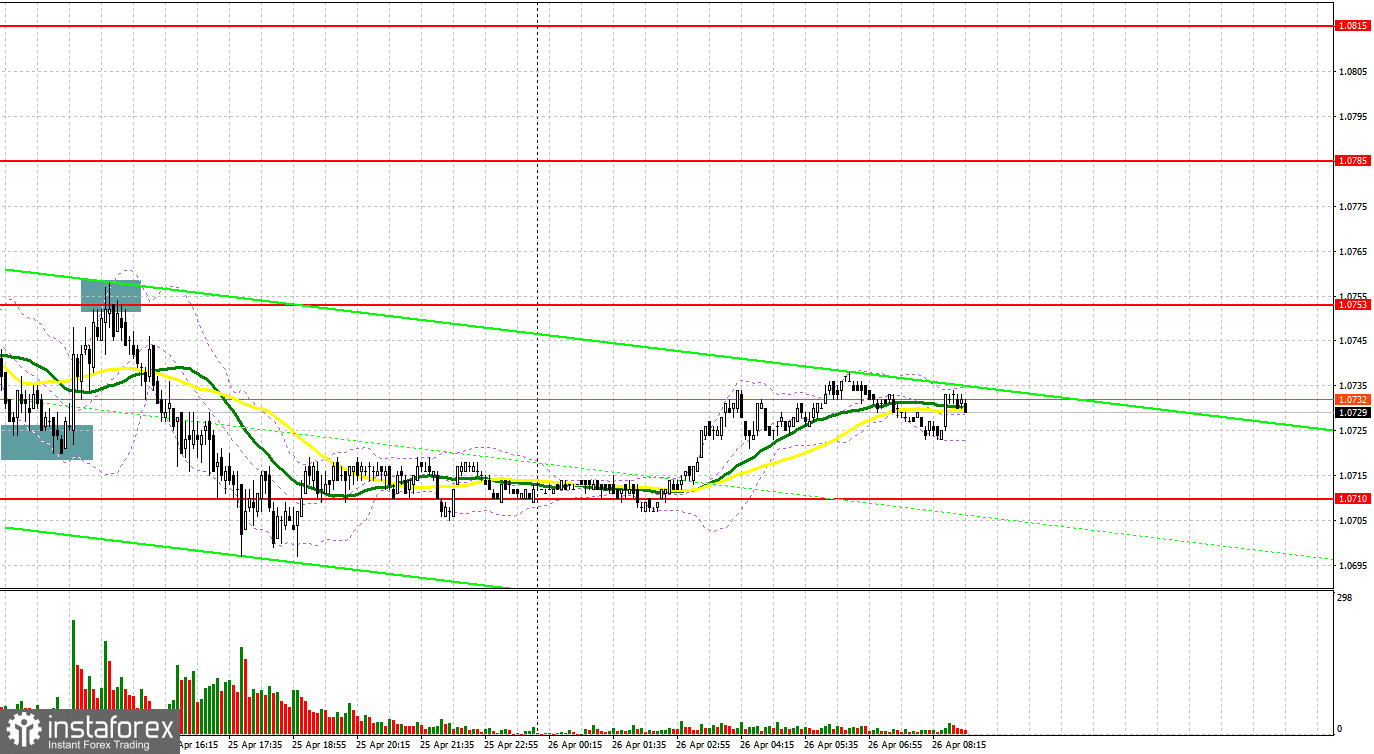
A number of signals were made yesterday. Let's turn to the 5-minute chart and try to figure out what actually happened. In my previous overview, I paid attention to the level of 1.0723 and recommended that you made a decision to enter the market from it. A breakout and consolidation below 1.0723 with a bottom-top retest made an excellent sell entry point. The euro somewhat recovered versus the dollar after strong Ifo reports came out. However, demand eventually decreased. A false breakout at 1.0723 created a buy signal. The pair went up by about 30 pips and encountered resistance at 1.0753. A new sell signal was produced after the price had failed to settle above the mark and had returned below 1.0753. As a result, the instrument fell by over 50 pips. Bulls found the strength to protect the market only around the 1.0700 level.

When to go long on EUR/USD:
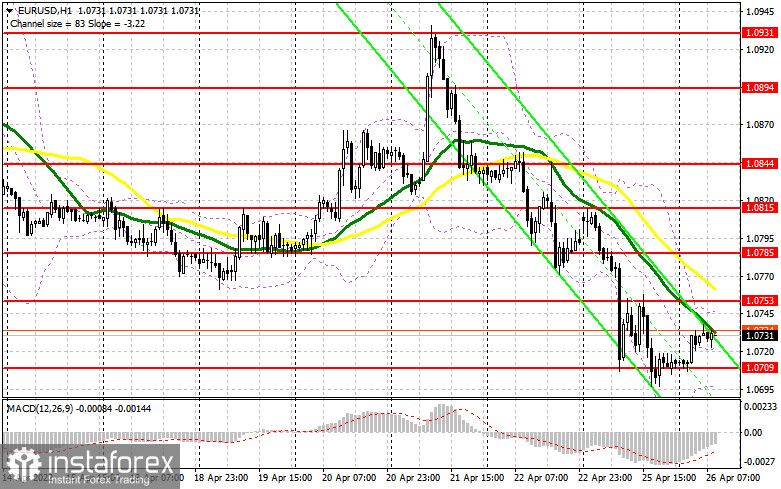
The euro was able to briefly advance after the release of strong Ifo results. Increasing inflationary pressure is posing a threat to the eurozone economy and is weighing on risk assets and their buyers. As to the greenback, demand for the currency is on the rise amid expectations of aggressive measures by the US Federal Reserve, and this trend is likely to continue. Bears need to take a break after the pair's recent plunge. The macroeconomic calendar in the eurozone does not contain any releases today. Therefore, the market is unlikely to enter a bullish correction. Of course, bulls would try to protect support at 1.0709. Buyers could open long positions from this mark after a false breakout with a view to taking the market under control. Yesterday, they lost it during the North American session. The pair may well return to 1.0753, in line with bearish moving averages. At the same time, it is hardly possible that the price goes above the range. Only a breakout and a bottom-top test of the 1.0753 level would create a buy signal. In such a case, the pair would return to 1.0785 where you should consider profit taking. In case of bearish EUR/USD and a decrease in bullish activity at 1.0709, you may look for buy entry points after a false breakout at around the 1.0672 high. Long positions on EUR/USD could also be entered on a bounce off 1.0636, or even lower, off 1.0572, allowing a 30-35 pips correction intraday.
When to go short on EUR/USD:
Bears are in control over the market. Pressure on the euro somewhat decreased as sellers need a time-out. Due to the empty macroeconomic calendar, bears have every chance to retain control over the market today. Clearly, it would be wise to go short after a false breakout at 1.0753, in line with moving averages. A false breakout there would create a sell signal with the target at 1.0709. Taking into account how fast the price is approaching the mark, we may expect bulls and bears to try to establish control over the market right there. A breakout and consolidation below the range followed by a top-bottom retest of the level would trigger a new sell of the euro with targets at 1.0672 and 1.0636, where you should consider profit taking. A more distant target is seen at 1.0572. However, the price would be able to go there only after the release of macro reports in the United States. We will talk about this scenario later when I present my outlook for the North American session to you. In the event of bullish EUR/USD during the European session and a decrease in bearish activity at 1.0753, you may look for sell entry points after a false breakout at 1.0785. Short positions on EUR/USD could also be entered on a bounce off 1.0815 or even higher, off 1.0844, allowing a 25-30 pips downward correction intraday.

Commitments of Traders:
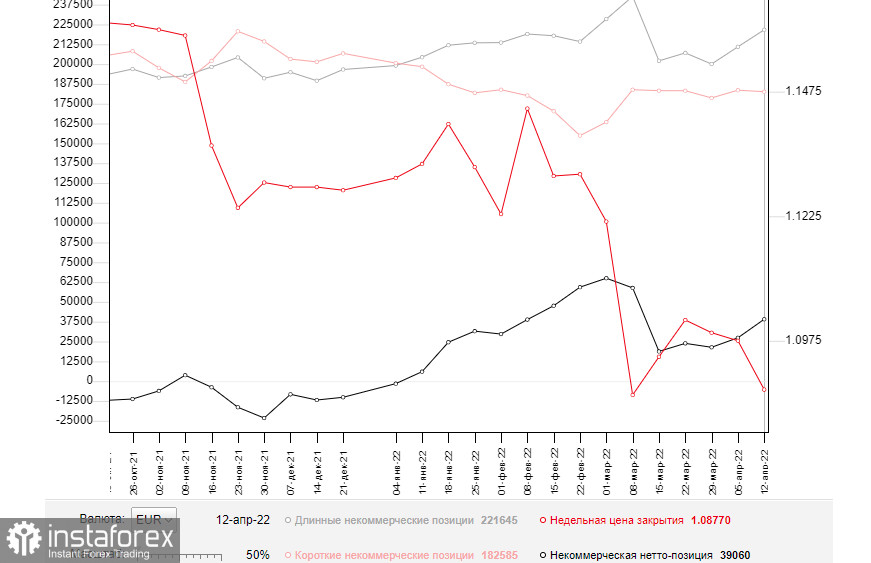
The Commitments of Traders report for April 12 logged a steep rise in long positions and a decrease in short ones. Last week, ECB President Lagarde announced the regulator's plan to end the bond-buying program and initiate rate hikes by the 3 quarter. Rising inflation in the eurozone has had a serious impact on the incomes of households. However, the eurozone is not the only one dealing with this problem. In the United States, the consumer price index hit the 40-year high, leaving the Federal Reserve no other choice but to resort to an aggressive stance. The regulator is expected to increase rates by 50 basis points at the May meeting. In this light, the greenback would be in demand, and EUR/USD will go further down. Geopolitical developments in Ukraine exert additional pressure on the euro. According to the COT report for April 12, long non-commercial positions rose to 221,645 from 210,914. Short non-commercial positions dropped to 182,585 from 183,544. In spite of an increase in the number of long positions, the COT report has always been of secondary importance. Therefore, its results cannot reflect the entire picture. At the same time, the weakening of the euro makes it an attractive investment instrument. That is why the number of long positions grew. As a result, non-commercial net positions increased to 39,060 from 27,370. The weekly closing price plunged by almost 100 pips to 1.0877 versus 1.0976.

Indicator signals:
Moving averages
Trading is carried out below the 30-day and 50-day moving averages, indicating that the bear trend has resumed.
Note: The period and prices of moving averages are viewed by the author on the hourly chart and differ from the general definition of classic daily moving averages on the daily chart.
Bollinger Bands
The lower band at 1.0700 stands as support. Resistance is seen at 1.0745 in line with the upper band.
Indicator description:
- Moving average (MA) determines the current trend by smoothing volatility and noise. Period 50. Colored yellow on the chart.
- Moving average (MA) determines the current trend by smoothing volatility and noise. Period 30. Colored green on the chart.
- Moving Average Convergence/Divergence (MACD). Fast EMA 12. Slow EMA 26. SMA 9.
- Bollinger Bands. Period 20
- Non-commercial traders are speculators such as individual traders, hedge funds, and large institutions who use the futures market for speculative purposes and meet certain requirements.
- Long non-commercial positions are the total long position of non-commercial traders.
- Non-commercial short positions are the total short position of non-commercial traders.
- Total non-commercial net position is the difference between short and long positions of non-commercial traders.


