


Analysis of previous deals:
30M chart of the EUR/USD pair
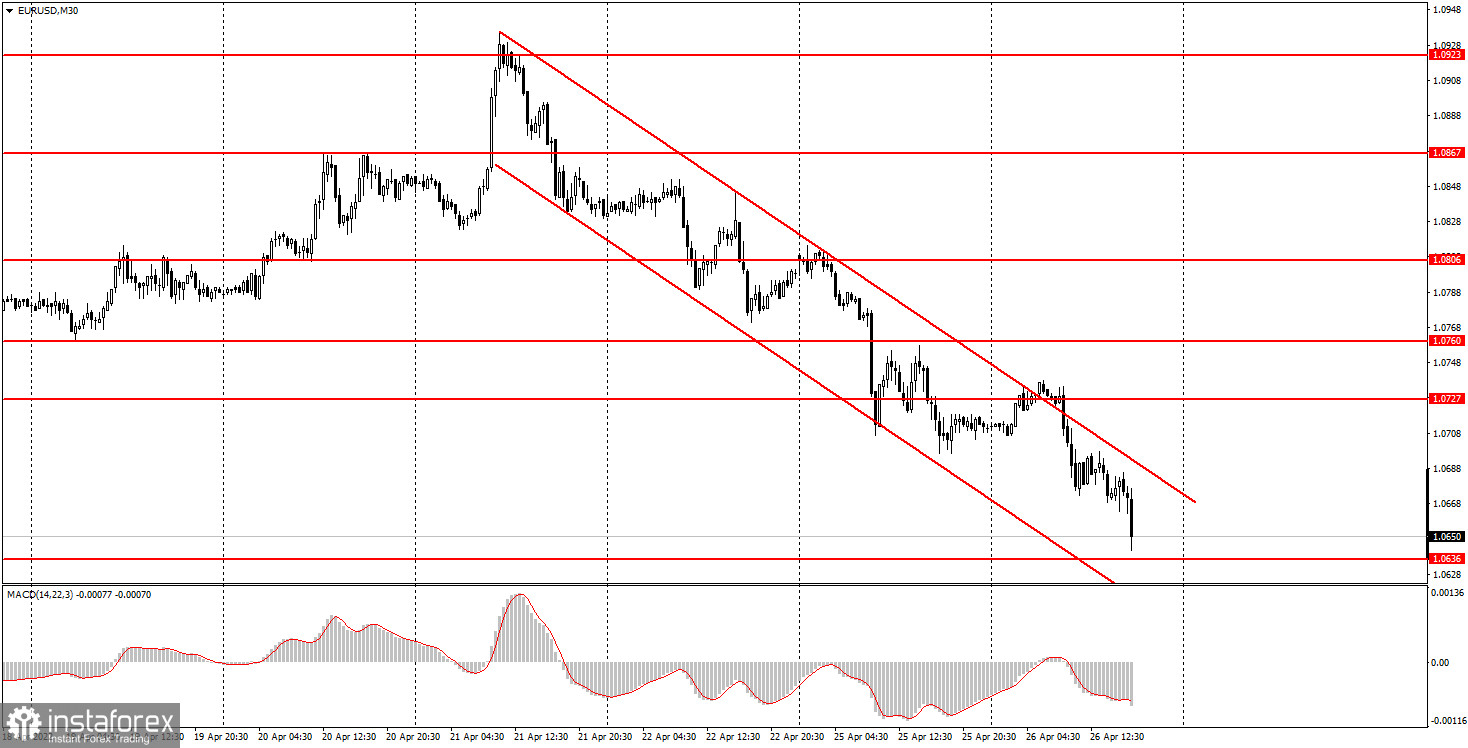
The EUR/USD currency pair, after a slight pause, easily and simply resumed its downward movement on Tuesday. We have been expecting an upward correction for two days already, simply because there are simply no good reasons and grounds for the euro to continue falling after a sharp decline last week. Yes, the general fundamental, geopolitical and macroeconomic backgrounds continue to be entirely on the side of the US currency. However, this does not mean that now the euro should lose 300-400 points in a few days! It's still a lot. Moreover, as we have already said, there were no important events or reports either in the European Union or the US on Monday and Tuesday. However, today the pair lost another 60 points and is now trading in close proximity to the 1.0636 level, which is a 5-year low. The descending channel is rather formal, as it has too much slope and a very narrow appearance. It will be quite simple to get out of it - you need a correction in terms of strength. Thus, the downward trend continues, and the overall outlook for the euro remains vague. However, we continue to expect a correction. Although, this does not mean that you should buy the pair now - after all, we see a strong downward trend.
5M chart of the EUR/USD pair
The technical picture looks pretty good on the 5-minute timeframe. Several trading signals were formed and all of them are accurate and strong. Once again, we draw your attention to the fact that when the movement is trending (even if not strong), trading any instrument can be very profitable. Therefore, naturally, one should try to avoid flat days and actively trade on trending days. Today, the first sell signal was formed at the very beginning of the European trading session, when the pair overcame the level of 1.0727. After that, the price continued to fall and overcame the level of 1.0697. And then it bounced off the same level twice from below. Therefore, in fact, four sell signals were formed today, but only one short position should have been opened. As a result, the pair went down 74 points in total. Unfortunately, the price did not manage to reach the 1.0636 level by just a few points, otherwise traders would have received an ideal exit point from the transaction. However, in the late afternoon, in any case, the deal had to be closed manually, so 50-60 points could be obtained completely freely.
How to trade on Wednesday:
The trend remains downward on the 30-minute timeframe, which is especially evident on the higher timeframes. On the 30-minute timeframe, the entire downward trend has not been on the chart for a long time, but even its last section perfectly illustrates what is happening now in the market. So far, there is not even an upward correction, and settling above the channel does not guarantee the beginning of this very correction - the channel is quite formal. On the 5-minute TF tomorrow it is recommended to trade at the levels of 1.0636, 1.0697, 1.0727, 1.0760, 1.0806. When passing 15 points in the right direction, you should set Stop Loss to breakeven. On Wednesday, the European Union will host a speech by European Central Bank President Christine Lagarde. Moreover, the calendar includes as many as three speeches by the ECB chairman. Each of them could provoke a market reaction, especially in light of the confusion that arose last week, when Lagarde and de Guindos voiced completely different rhetoric regarding the key rate.
Basic rules of the trading system:
1) The signal strength is calculated by the time it took to form the signal (bounce or overcome the level). The less time it took, the stronger the signal.
2) If two or more deals were opened near a certain level based on false signals (which did not trigger Take Profit or the nearest target level), then all subsequent signals from this level should be ignored.
3) In a flat, any pair can form a lot of false signals or not form them at all. But in any case, at the first signs of a flat, it is better to stop trading.
4) Trade deals are opened in the time period between the beginning of the European session and until the middle of the American one, when all deals must be closed manually.
5) On the 30-minute TF, using signals from the MACD indicator, you can trade only if there is good volatility and a trend, which is confirmed by a trend line or a trend channel.
6) If two levels are located too close to each other (from 5 to 15 points), then they should be considered as an area of support or resistance.
On the chart:
Support and Resistance Levels are the Levels that serve as targets when buying or selling the pair. You can place Take Profit near these levels.
Red lines are the channels or trend lines that display the current trend and show in which direction it is better to trade now.
The MACD indicator (14,22,3) consists of a histogram and a signal line. When they cross, this is a signal to enter the market. It is recommended to use this indicator in combination with trend lines (channels and trend lines).
Important speeches and reports (always contained in the news calendar) can greatly influence the movement of a currency pair. Therefore, during their exit, it is recommended to trade as carefully as possible or exit the market in order to avoid a sharp price reversal against the previous movement.
Beginners on Forex should remember that not every single trade has to be profitable. The development of a clear strategy and money management are the key to success in trading over a long period of time.


