


Analysis of Tuesday's trades:
30M chart of GBP/USD
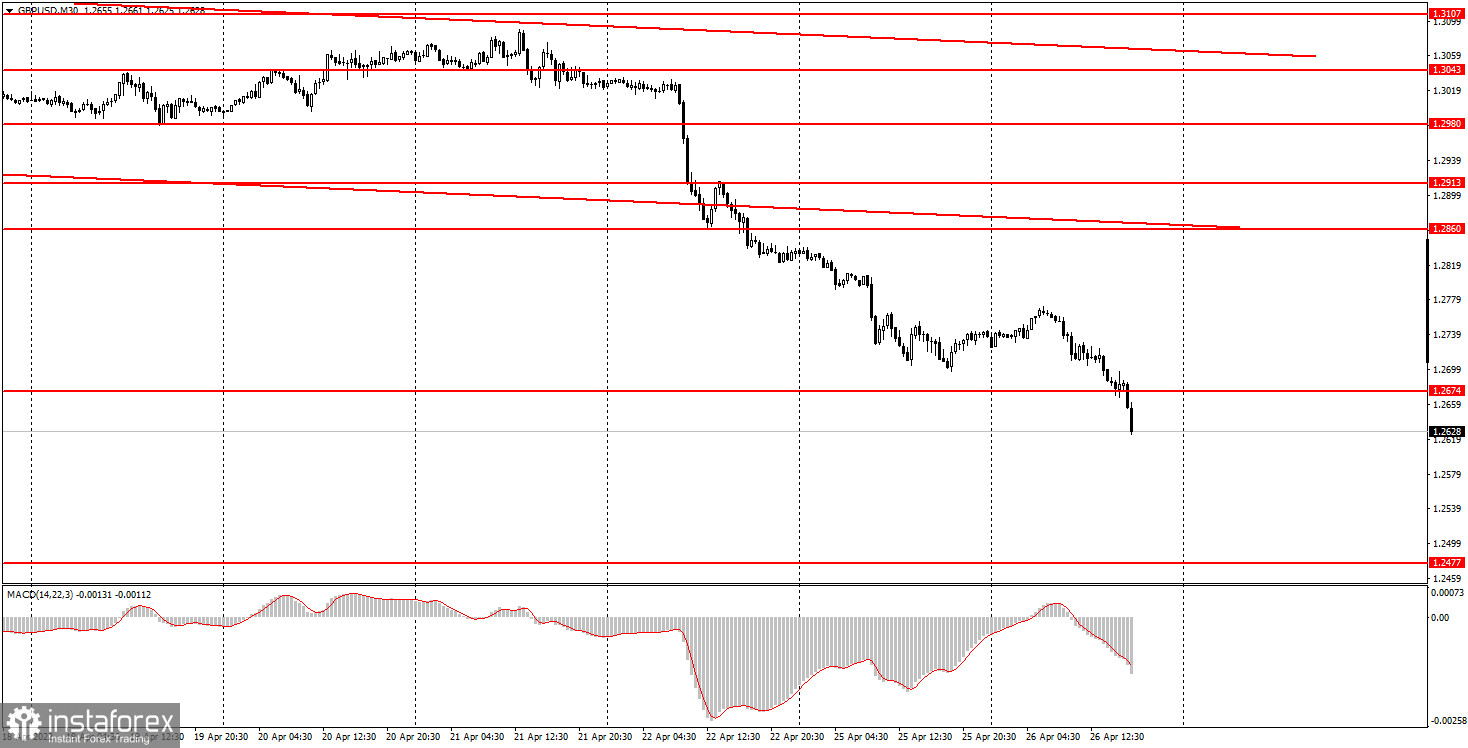
On Tuesday, GBP/USD moved down without even trying to enter a bullish correction. Over the past 3 days, the pound lost 400 pips, which is too much even for the British currency. The price has long gone below the descending channel. Anyway, the downtrend is now visible to the naked eye in almost any time frame. The quote has been in the bear trend for more than 15 months now. Above all else, the greenback has recently become even stronger. The United Kingdom saw no important macro releases that could trigger a plunge in the pound in the first two trading days of the week. The United States published its durable goods orders statistics on Tuesday. The report came worse than economists had expected. In any case, the results could only drive the greenback down, not up. Nevertheless, they had absolutely no effect on the pair because the downtrend had resumed long before the release and lasted all day long. Traders were able to break the 1.2674 barrier, the 20-month low. They are now pushing the price to the all-time low of 1.1411, last seen 25 years ago.
5M chart of GBP/USD
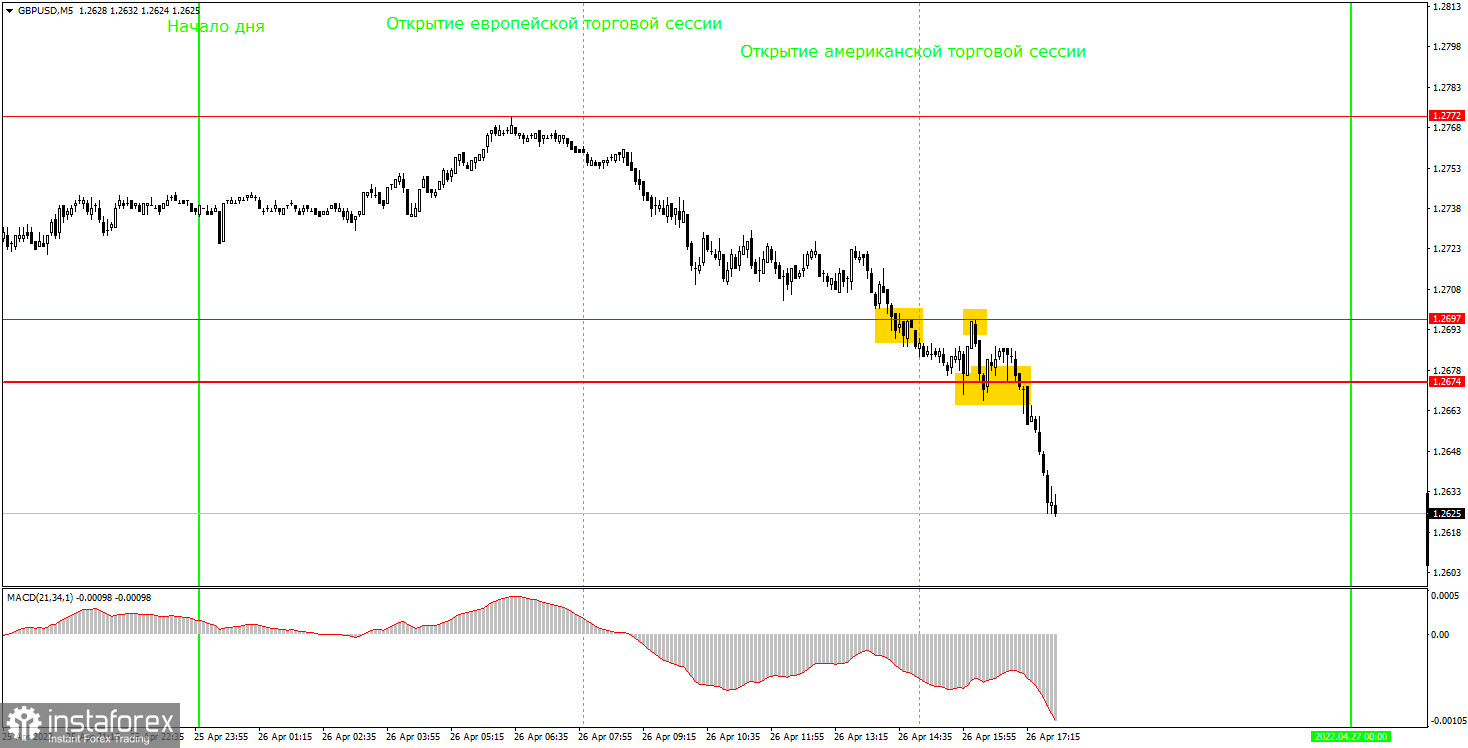
In the M5 time frame, the pair was in a trend. However, taking into account the fact that the price had not been at the current levels for more than 18 months, we should have expected a limited number of trading signals to be created. So, a few signals were made on Tuesday. Interestingly, levels 1.2674 and 1.2697 should not have been seen as a support zone because the gap between them was as many as 24 pips. However, when the price appeared in the range, it almost came to a standstill, making a few rebound signals. The first sell signal was generated when the quote broke through 1.2697. The price then bounced off 1.2674 and 1.2697, and a breakout at 1.2674 followed. Overall, there were 4 signals made, 3 of which could have brought some 5-10 pips of profit if trades were closed at the right time. The last sell signal was the most profitable one. It was created when the pair broke through 1.2674. As soon as it was made, the price fell by about 35 pips. Since there were no target levels below 1.2674, short positions should have been closed manually.
Trading plan for Wednesday:
In the 30M time frame, the bearish trend goes on. In recent weeks, the pair has traded mixed. At this stage, we saw how the price collapsed out of the blue. Due to the pair's mixed behavior in recent weeks, the trend line has not been formed yet. We may still expect the quote to extend the downtrend in the short term. In the medium term, however, there is an impending correction. On Wednesday, the target levels in the 5M time frame are seen at 1.2674, 1.2697, and 1.2860. A stop-loss order should be set at the breakeven point as soon as the price passes 20 pips in the right direction after a trade has been opened. The macroeconomic calendar in the UK, as well as in the US, contains no important releases on Wednesday. As we can see, the market needs no reasons right now to sell the pound.
Basic principles of the trading system:
1) The strength of the signal depends on the time period during which the signal was formed (a rebound or a break). The shorter this period, the stronger the signal.
2) If two or more trades were opened at some level following false signals, i.e. those signals that did not lead the price to the Take Profit level or the nearest target levels, then any consequent signals near this level should be ignored.
3) During the flat trend, any currency pair may form a lot of false signals or produce no signals at all. In any case, the flat trend is not the best condition for trading.
4) Trades are opened in the time period between the beginning of the European session and until the middle of the American one when all deals should be closed manually.
5) We can pay attention to the MACD signals in the 30M time frame only if there is good volatility and a definite trend confirmed by a trend line or a trend channel.
6) If two key levels are too close to each other (about 5-15 pips), then this is a support or resistance area.
How to interpret charts:
Support and resistance levels can serve as targets when buying or selling. You can place Take Profit near them.
Red lines are channels or trend lines that display the current trend and show which direction is better to trade.
MACD indicator (14,22,3) is a histogram and a signal line showing when it is better to enter the market when they cross. This indicator is better to be used in combination with trend channels or trend lines.
Important speeches and reports that are always reflected in the economic calendars can greatly influence the movement of a currency pair. Therefore, during such events, it is recommended to trade as carefully as possible or exit the market in order to avoid a sharp price reversal against the previous movement.
Beginner traders should remember that every trade cannot be profitable. The development of a reliable strategy and money management is the key to success in long-term trading.


