


So it's time to consider one of the most interesting and popular euro/pound pairs. As has been noted more than once, the price dynamics of EUR/GBP often have a significant impact on the direction of the majors, that is, the main currency pairs EUR/USD and GBP/USD. The growth of the euro/pound leads to a strengthening of the position of the single European currency in a pair with the US dollar and vice versa. Although today is already the middle of the trading week, I will start the technical analysis of EUR/GBP with a weekly timeframe.
Weekly
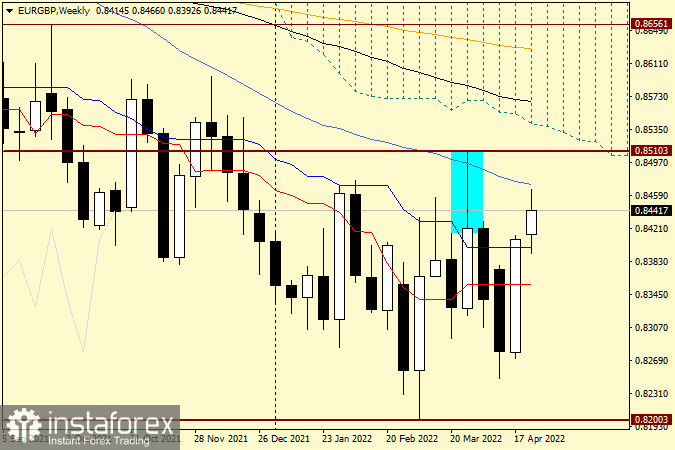
As you can see, at the auction of the last five days, the pair showed rather impressive growth. As a result of this rise, the red Tenkan line and the blue Kijun line of the Ichimoku indicator were passed up, which, of course, should be attributed to a bullish signal. However, until the highlighted bullish candle with a very long upper shadow is blocked by growth, it is not possible to draw unambiguous conclusions about the further growth of the quote. At the auction of the current five-day period, the euro/pound rolled back to the Kijun line passed before, expected to find support there, after which it turns up and prepares to test the strength of the blue 50-simple moving average. However, even passing up the 50-MA will not solve the whole problem of the EUR/GBP bulls yet. To indicate further growth, players need to go up the iconic psychological level of 0.8500 and break through the strong resistance of sellers at 0.8510 with the indispensable closing of the week above this level. If, following the results of weekly trading, a bearish reversal model of candle analysis appears on this chart, it will be just right to expect a decrease in the pair.
Daily
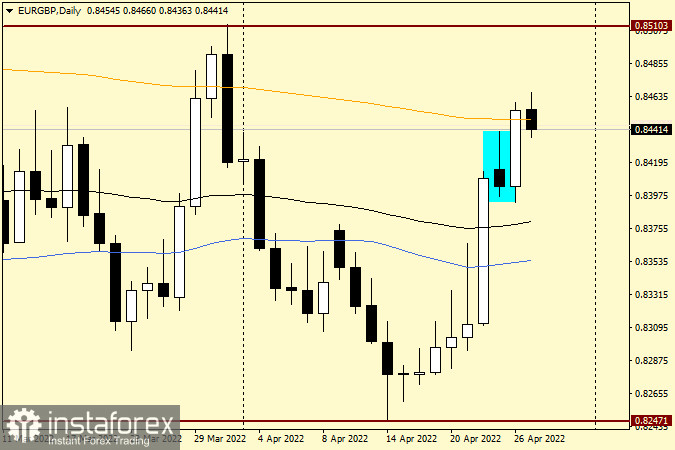
Despite the reversal candlestick pattern for April 25, the very next day, that is, yesterday, the market blocked it with growth, or simply broke it. Moreover, yesterday's session ended above the strong orange 200-exponential moving average, which creates good prospects for further growth. Today, a rollback has already been given to the 200-EMA passed the day before, which can even be considered an attempt by bears to return the quote to the 200-exponent. However, at the end of the article, today's candle already has a rather impressive lower shadow, which signals the intentions of the pair to continue the implementation of the upward scenario. If we denote trading recommendations for EUR/GBP, then, given the technical picture on these two timeframes considered, as well as the current weakness of the British currency, purchases look like the main trading idea. To open long positions, I suggest waiting for a corrective pullback to the 0.84540-0.08430 price zone, and when bullish candle signals appear there at smaller time intervals, consider opening purchase transactions. I consider opening long positions at the breakdown of the 50-MA and (or) the breakthrough of the psychological level of 0.8500 to be a more risky positioning, since corrective pullbacks downwards, or even a reversal of the course, are possible for buyers.


