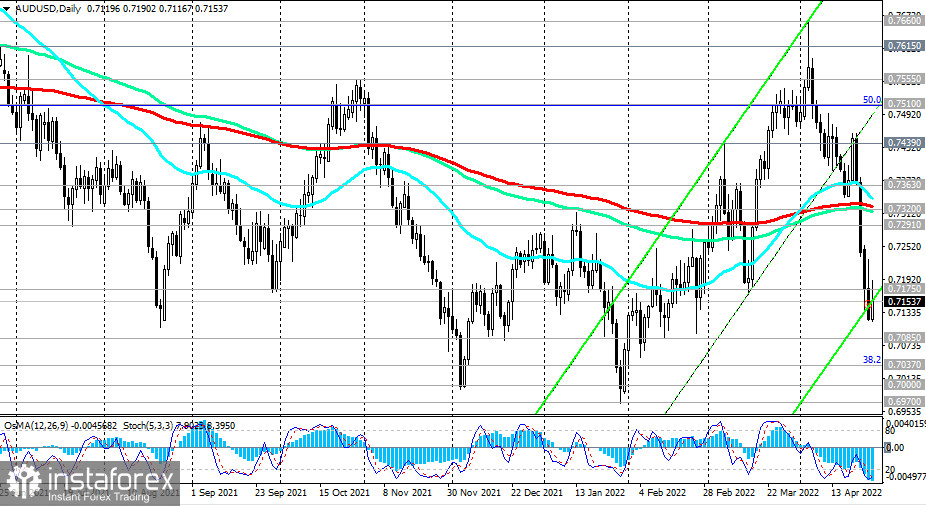
At the time of writing, AUD/USD is trading near 0.7154, having strengthened from today's and the 9-week low of 0.7117.

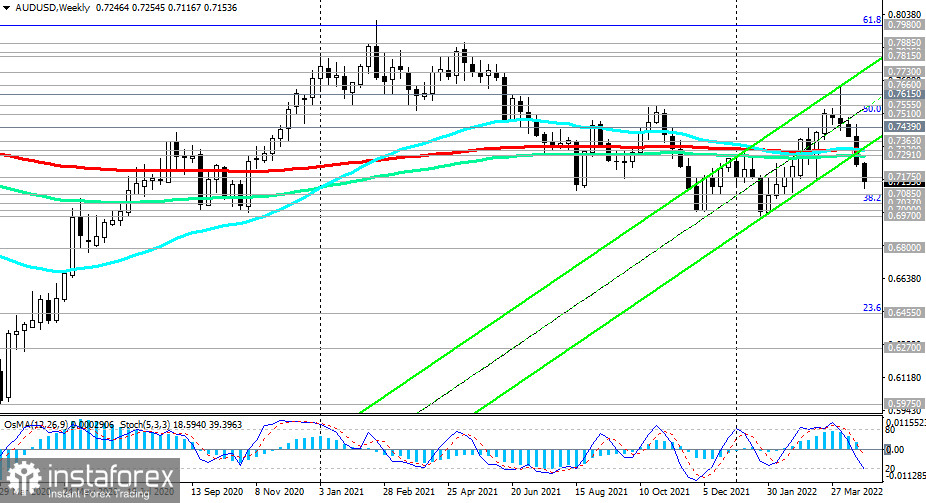
Since the beginning of this month, the AUD/USD pair has lost almost 5%, although it has attempted to break into the zone of a long-term bull market above the key resistance levels of 0.7615 (200 EMA on the monthly chart), and 0.7660 (144 EMA on the monthly chart).
Technical indicators OsMA and Stochastic on the daily, weekly, and monthly charts are in the zone of sales, while economists believe that AUD/USD may fall to 0.7000. The signal for strengthening the downward movement of the pair will obviously be the breakdown of today's local low at 0.7117.

The downside targets, in this case, are support levels 0.7085, 0.7037 (38.2% Fibonacci retracement to the wave of the pair's decline from 0.9500 in July 2014 to 2020 lows near 0.5510), 0.7000, 0.6970 (an alternative scenario). Now, apparently, it is becoming the main scenario, and the alternative is the growth of AUD/USD.

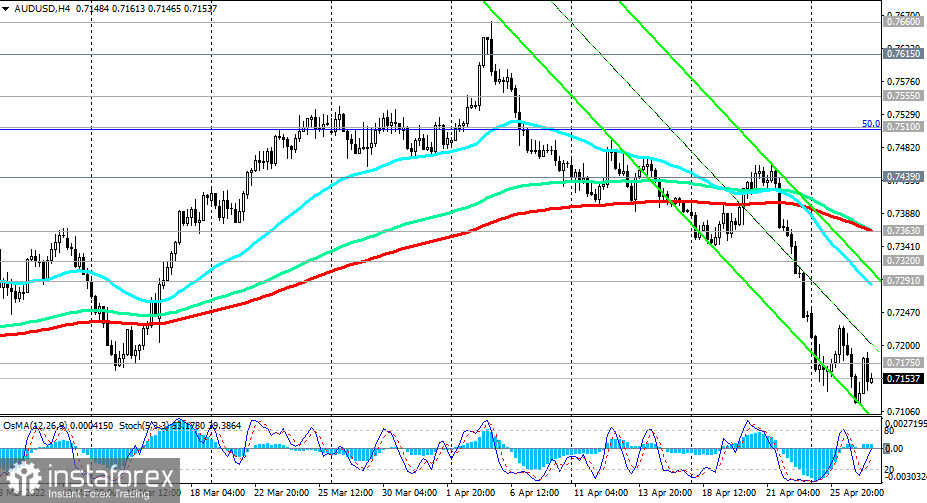
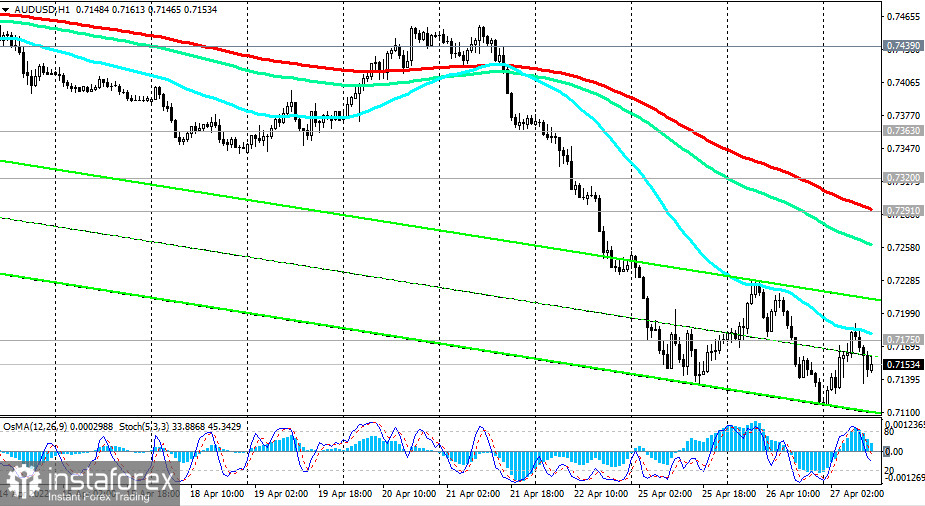
The first signal for the implementation of an alternative scenario will be a breakdown of the local resistance level of 0.7228. In case of a breakdown of the important short-term resistance level 0.7291 (200 EMA on the 1-hour chart), the correction may intensify up to the resistance level of 0.7320 (200 EMA on the daily chart).

A breakdown of the resistance level 0.7363 (200 EMA on the 4-hour chart) will once again instill confidence in buyers and send AUD/USD towards this month's highs and to 0.7615, 0.7660.
Support levels: 0.7117 , 0.7100, 0.7085, 0.7037, 0.7000, 0.6970
Resistance levels: 0.7175 0.7228 0.7291 0.7320 0.7363 0.7400 0.7439 0.7465 0.7510 0.7555 0.7615 0.7660 0.7730 0.7815
Trading tips
Sell Stop 0.7110. Stop-Loss 0.7230. Take-Profit 0.7100, 0.7085, 0.7037, 0.7000, 0.6970, 0.6900
Buy Stop 0.7230. Stop-Loss 0.7110. Take-Profit 0.7290, 0.7320, 0.7360, 0.7400, 0.7439, 0.7465, 0.7510, 0.7555, 0.7615, 0.7660, 0.7730, 0.7815, 0.7835, 0.7885, 0.7900, 0.8000


