


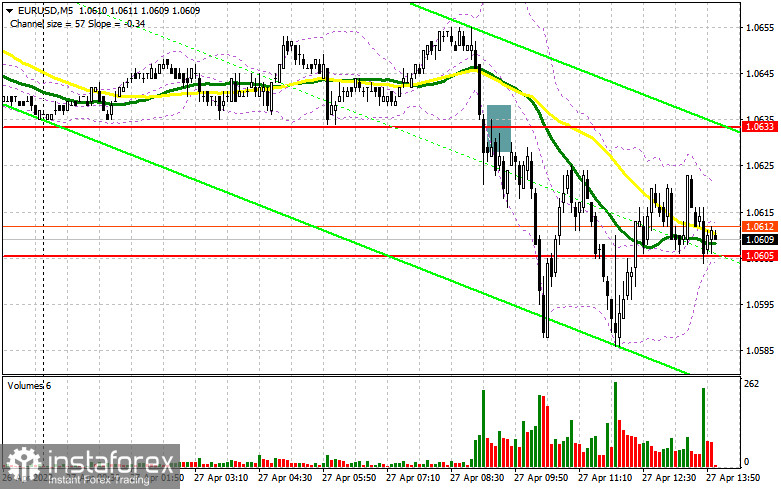
Earlier, I asked you to pay attention to the level of 1.0633 to decide when to enter the market. Let us take a look at the 5-minute chart to analyze the market situation. A break and settlement below 1.0633 and an upward test of this level gave a good sell signal, thus causing a massive sell-off. As a result, the price tumbled to the support level of 1.0605, which was also broken. A surge in volatility did not give a new sell signal. Thus, we had to revise the market picture from the technical point of view.
Conditions for opening long positions on EUR/USD:
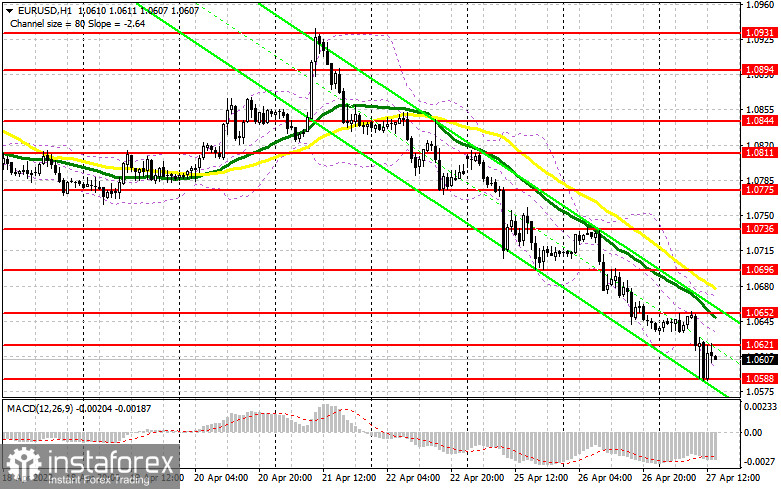
Today, Germany disclosed very weak data on the consumer climate indicator for May. The data turned out to be significantly below the forecast. This fact caused a new wave of the euro's sell-off. As a result, the currency dropped below the low of 2020. In the second part of the day, reports from the US will hardly encourage buyers of the euro, which is trying to fix at the low of 1.0588. Extremely good reports on trade balance, wholesale inventories, and pending home sales will boost demand for the US dollar. That is why it will be very difficult to protect the support level of 1.0588. If the euro/dollar pair falls to this level, only a false break of this level will provide a buy signal. Until the pair hovers above this area, it may recover to 1.0621. A break and consolidation above this level may affect stop orders of sellers. At the same time, a downward test of the level will give a buy signal, allowing the pair to climb to 1.0652. A farther target is located at 1.0696, where it is recommended to lock in profit. In case of a further drop in the second part of the day and a failure to protect 1.0588, it will be wise not to open long positions. Traders may consider opening long positions only after a false break of 1.0636. It is also possible to open long positions from 1.0558 or lower – from 1.0527, expecting an upward correction of 30-35 pips.
Conditions for opening short positions on EUR/USD:
Sellers continue exerting pressure on the euro. The bearish trend could be proved by a break of the support level and a new weekly low. Today, bears should primarily protect the nearest resistance level of 1.0621. The pair will be able to return to this level only in case of weak data from the US and Christine Lagarde's comments on the key interest rate hike planned for this year. A false break of 1.0621 will give a sell signal with the target at 1.0588. A break and an upward test of this level may cause a new sell-off of the euro, thus pushing it lower to 1.0558. A farther target is located at such lows as 1.0527 and 1.0498, where it is recommended to lock in profit. If the euro rises in the second part of the day and bears fail to protect 1.0621, the pair may jump if traders lock in profit near yearly lows. In this case, it will be wise to go short after a false break of 1.0652. It is also possible to sell the euro from 1.0696 or higher – from 1.0736, expecting a drop of 25-30 pips.
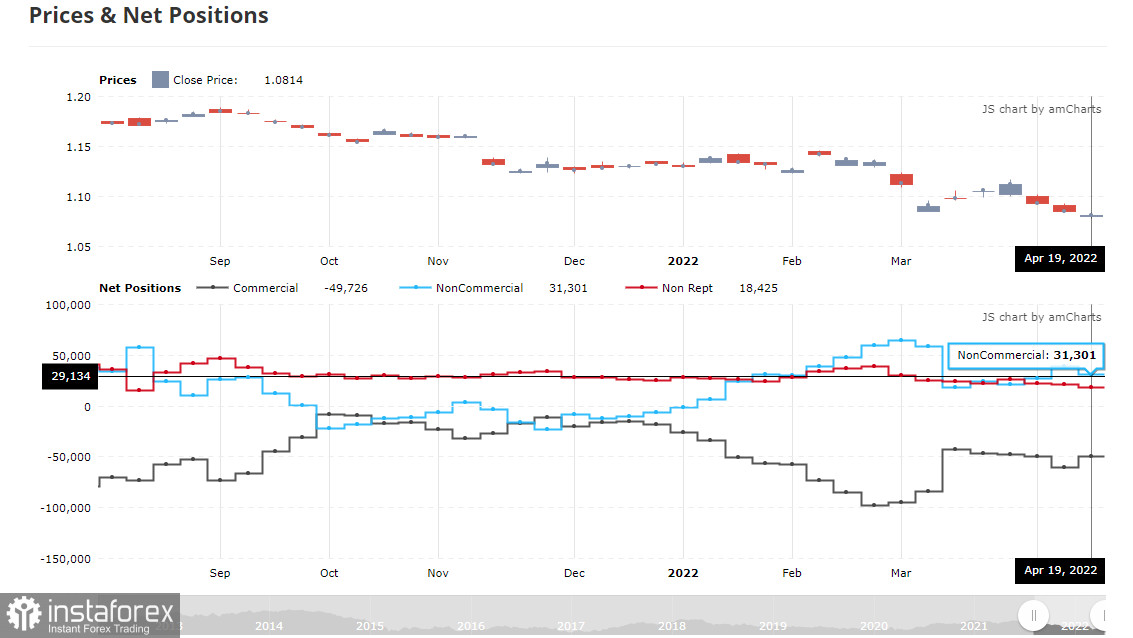
COT reportAccording to the COT report from April 19, the number of short positions jumped, whereas the number of long positions dropped. The recent comments provided by representatives of central banks led to a massive sell-off of risk assets. The central banks' officials made it clear that developed economies were likely to face grave problems this year. Although the ECB president emphasizes that the regulator is planning to close its asset-purchasing program by the end of the second quarter, it is not enough to support the euro. Fed's more aggressive policy and its intention to raise the benchmark rate by 0.75% in May are supporting the greenback. In addition, global economic slowdown could be caused by quarantine measures imposed in China to curb the new virus wave. Such actions have already led to serious disruptions in supply to European and Asian countries.Against the backdrop, demand for the US dollar remains very high, thus pushing the euro/dollar pair lower. Military actions in Ukraine are also exerting pressure on the euro. The COT report unveiled that the number of long non-commercial positions dropped to 221,003 from 221,645, while short non-commercial positions surged to 189,702 from 182,585. The decline in the euro makes it more attractive for investors. At the end of the week, the total non-commercial net position decreased to 34,055 against 39,060. The weekly closing price collapsed to 1.0814 against 1.0855.
Signals of indicators:
Moving Averages
Trading is performed below 30- and 50-day moving averages, thus pointing to the continuation of the bearish trend.
Note: The period and prices of moving averages are considered by the author on the one-hour chart that differs from the general definition of the classic daily moving averages on the daily chart.
Bollinger Bands
In case of a rise, the upper limit of the indicator located at 1.0652 will act as resistance.
Description of indicators
- Moving average (moving average, determines the current trend by smoothing volatility and noise). The period is 50. It is marked in yellow on the chart.
- Moving average (moving average, determines the current trend by smoothing volatility and noise). The period is 30. It is marked in green on the graph.
- MACD indicator (Moving Average Convergence/Divergence - convergence/divergence of moving averages). A fast EMA period is 12. A slow EMA period is 26. The SMA period is 9.
- Bollinger Bands. The period is 20.
- Non-profit speculative traders are individual traders, hedge funds, and large institutions that use the futures market for speculative purposes and meet certain requirements.
- Long non-commercial positions is a total number of long positions opened by non-commercial traders.
- Short non-commercial positions is a total number of short positions opened by non-commercial traders.
- The total non-commercial net position is a difference in the number of short and long positions opened by non-commercial traders.


