


Analysis of previous deals:
30M chart of the EUR/USD pair
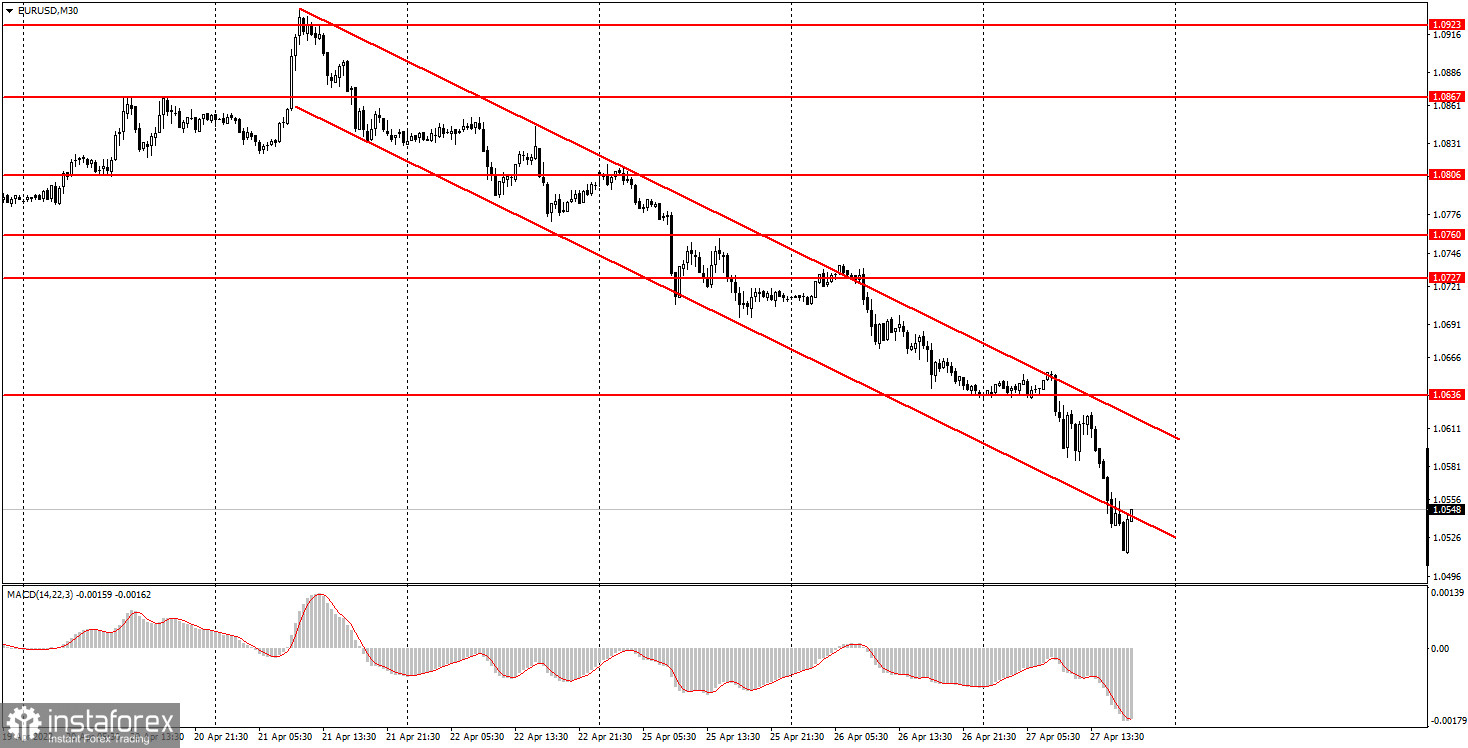
The EUR/USD currency pair on Wednesday guess what? That's right, continued a strong downward movement. We no longer wonder what were the reasons for the short positions on the European currency on Wednesday, as they started again before all the planned events of the day. However, there were few of these "planned events" – only European Central Bank President Christine Lagarde's speech. At the moment, nothing is known about her speech, so it is unlikely that today's fall was provoked by it. Most likely, the market continued to get rid of the euro. There is simply no other explanation. The fundamental, geopolitical and macroeconomic backgrounds remain quite difficult for the euro, but there is a limit to everything! Now the euro's fall looks excessively strong, undeserved. We believe that if the geopolitical situation in Ukraine does not deteriorate sharply in the coming weeks/months, then the euro may complete a long cycle of falling against the dollar in the near future. A descending channel appeared in the chart of the 30-minute TF, but it is quite narrow, almost any correction of the pair will lead to the exit of quotes from it. Therefore, it is practically meaningless.
5M chart of the EUR/USD pair
The technical picture looks pretty good on the 5-minute timeframe. The pair was in a trend movement for most of Wednesday, and the volatility was 142 points, which is a lot. Recall that even after the meetings of the ECB or the Federal Reserve, such volatility is not always observed. However, we are interested in trading signals. There was only one today. But what! The price settled below the 1.0636 level at the beginning of the European trading session, after which it went down 110 points. The 1.0514 level is today's low, so it did not participate in today's trading. Novice traders had to close the short position manually in the late afternoon. The profit on it could be 70-80 points, which is good in any case. Once again, we draw your attention to: when the movement is strong and trending, you can earn a lot and relatively easily. Flat days should be avoided.
How to trade on Thursday:
The trend remains downward on the 30-minute timeframe, which is especially clearly seen on the higher TF. The entire downward trend has not been placed on the chart for a long time, but even its last section perfectly illustrates what is happening on the market now. The descending channel has joined the visualization of what is happening, and settling above it does not guarantee a strong growth for the euro. So far, it is quite difficult to say when the euro will stop falling. On the 5-minute TF tomorrow, it is recommended to trade at the levels of 1.0369, 1.0514, 1.0636, 1.0697. When passing 15 points in the right direction, you should set the Stop Loss to breakeven. ECB Vice-President Luis de Guindos will give a speech in the European Union on Thursday. In America, the GDP report for the first quarter of 2022, as well as applications for unemployment benefits. We believe that none of these events will provoke a strong market reaction. Perhaps only the US GDP report and only in case of a serious discrepancy between the forecast and the actual value. And the forecast is +1.0% q/q. This is very small compared to the last quarter, where a value of +6.9% was recorded. Nevertheless, the American economy still looks much more confident than the European one.
Basic rules of the trading system:
1) The signal strength is calculated by the time it took to form the signal (bounce or overcome the level). The less time it took, the stronger the signal.
2) If two or more deals were opened near a certain level based on false signals (which did not trigger Take Profit or the nearest target level), then all subsequent signals from this level should be ignored.
3) In a flat, any pair can form a lot of false signals or not form them at all. But in any case, at the first signs of a flat, it is better to stop trading.
4) Trade deals are opened in the time period between the beginning of the European session and until the middle of the American one, when all deals must be closed manually.
5) On the 30-minute TF, using signals from the MACD indicator, you can trade only if there is good volatility and a trend, which is confirmed by a trend line or a trend channel.
6) If two levels are located too close to each other (from 5 to 15 points), then they should be considered as an area of support or resistance.
On the chart:
Support and Resistance Levels are the Levels that serve as targets when buying or selling the pair. You can place Take Profit near these levels.
Red lines are the channels or trend lines that display the current trend and show in which direction it is better to trade now.
The MACD indicator (14,22,3) consists of a histogram and a signal line. When they cross, this is a signal to enter the market. It is recommended to use this indicator in combination with trend lines (channels and trend lines).
Important speeches and reports (always contained in the news calendar) can greatly influence the movement of a currency pair. Therefore, during their exit, it is recommended to trade as carefully as possible or exit the market in order to avoid a sharp price reversal against the previous movement.
Beginners on Forex should remember that not every single trade has to be profitable. The development of a clear strategy and money management are the key to success in trading over a long period of time.


