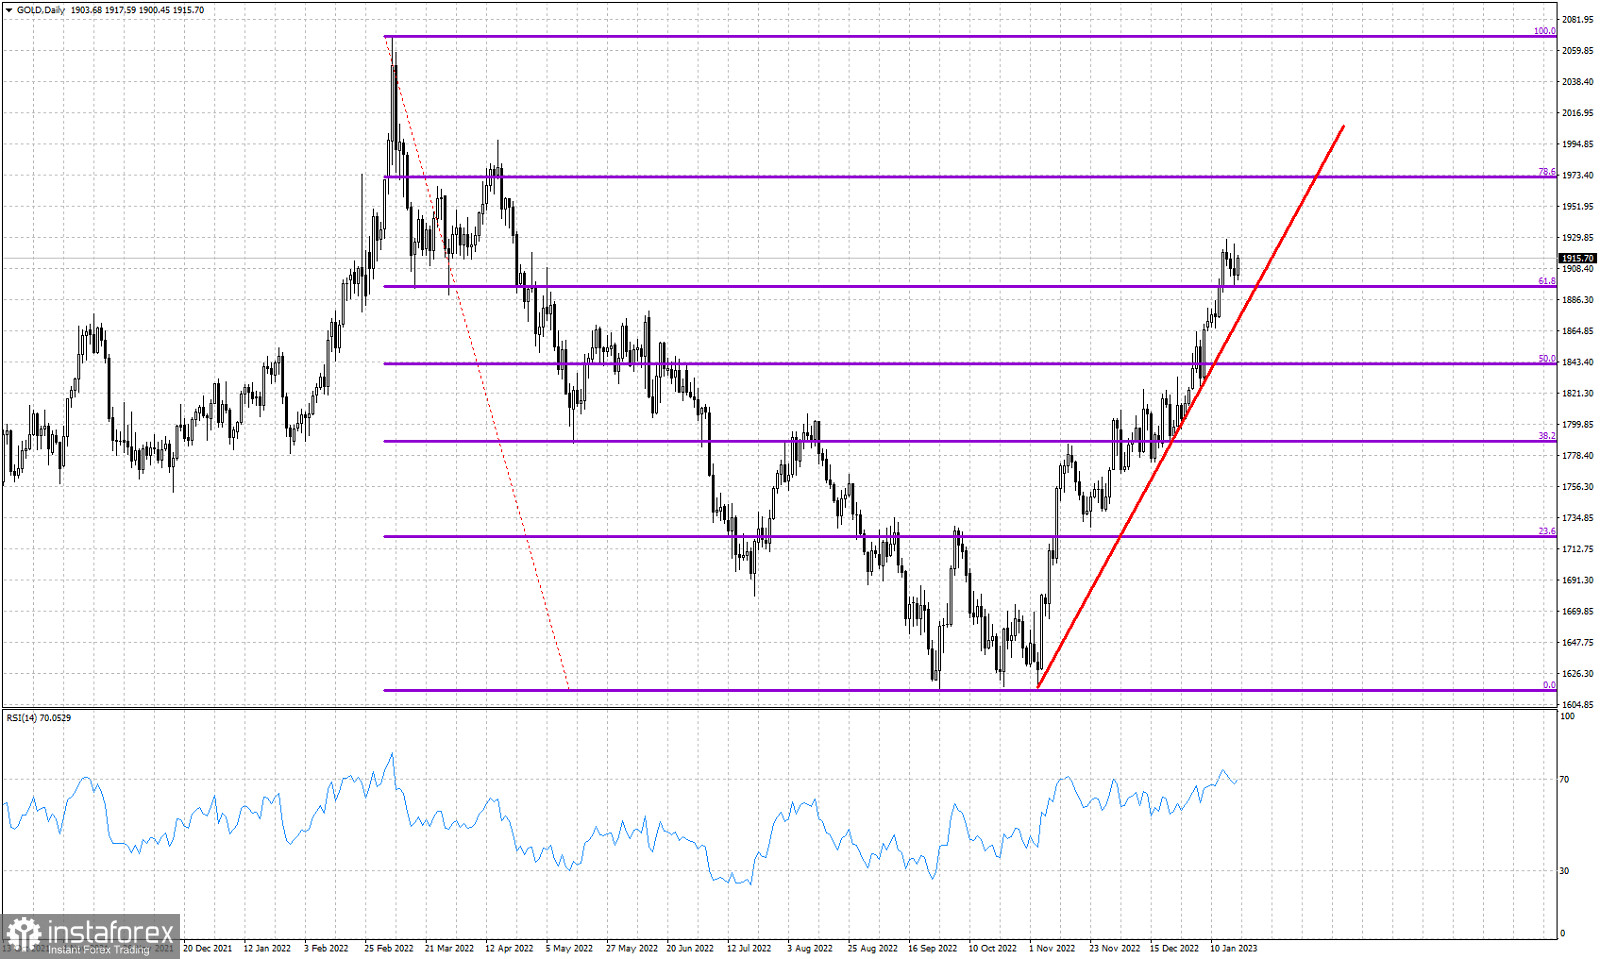
Red line- support trend line
Violet lines- Fibonacci retracement levels
Gold price is in a short-term bullish trend making higher highs and higher lows. Price continues to respect the red upward sloping trend line. Gold price has broken key Fibonacci resistance level of 61.8% at $1,896. At the 61.8% Fibonacci retracement we usually see trend reversals. Gold price has broken and back tested this level. The 61.8% level is now support. The RSI has reached overbought levels as Gold price climbs higher. So far there is no sign of a trend reversal. First sign of a reversal will be when price breaks below yesterday's lows and confirmation of the reversal will come with a break below the red support trend line. Until then bulls are in control.


