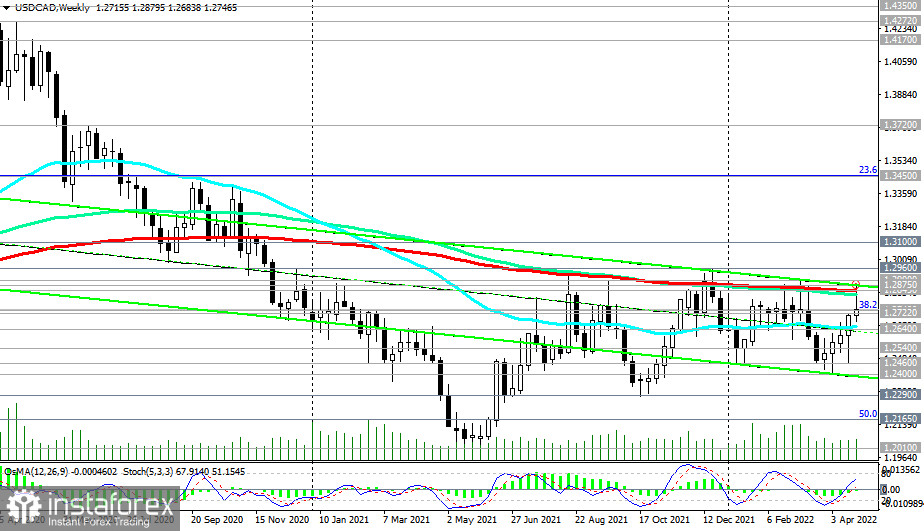
Since June 2021, USD/CAD has been trying to resume its long-term trend, settling at around 1.2000. At the moment of writing, the quote traded at around 1.2745,100 pips below the key resistance level of 1.2845, in line with EMA 200 on the weekly chart. Daily volatility of USD/CAD averages 100-150 pips. The pair may well break through the barrier in case of any strong drivers. It remains to be seen whether the quote is able to close in the range or extend growth.
The Bank of Canada's monetary policy is almost in line with the US Federal Reserve's. At the same time, inflation in Canada is lower than in the US. Meanwhile, rising oil prices are pushing the loonie up. Simply put, the Canadian dollar is almost as strong as the greenback.

Therefore, the pair needs a significant driver to break through and rise above swing resistance at 1.2900 and 1.2960.

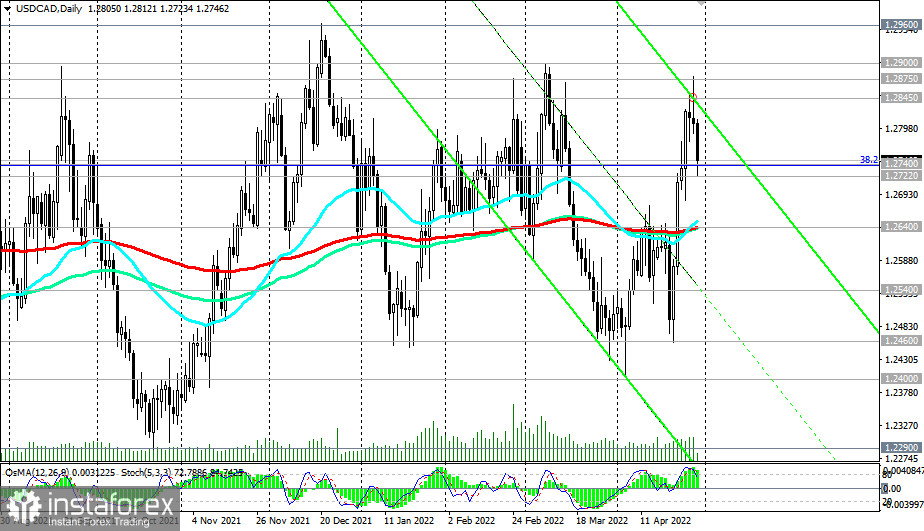
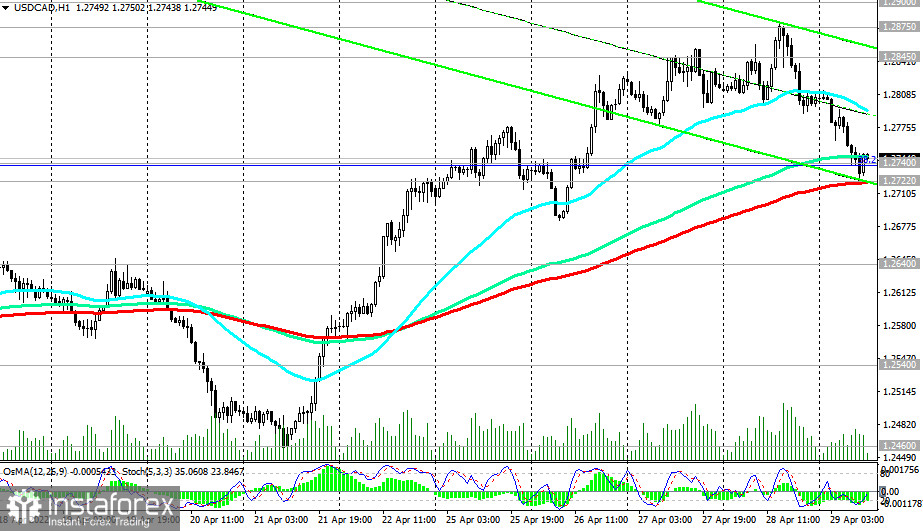
Technically, a nice buy entry point has been formed. The price trades around important support levels of 1.2722, in line with ema 200 on the 1-hour chart, and 1.2740, in line with the 38.2% Fibonacci level of the downward correction in the USD/CAD growth wave from 0.9700 to 1.4600. Resistance levels of 1.2800, 1.2845, 1.2875, and 1.2900 serve as targets.
Alternatively, a breakout at 1.2722 could make a sell signal. If so, USD/CAD could go inside the descending channel on the weekly chart. The channel's lower limit is at 1.2400, in line with swing support. More distant targets are seen at the support level of 1.2165, in line with the 50% Fibonacci level and the lower limit of the descending channel on the daily chart, and at around 1.2000, in line with the 2021 lows.
Support: 1.2740, 1.2722, 1.2640, 1.2540, 1.2460, 1.2400, 1.2290, 1.2165, 1.2050, 1.2000Resistance: 1.2800, 1.2845, 1.2875, 1.2900, 1.2960, 1.3000, 1.3100
Trading scenarios
Sell Stop 1.2710. Stop-Loss 1.2780. Take-Profit 1.2640, 1.2540, 1.2460, 1.2400, 1.2290, 1.2165, 1.2050, 1.2000Buy Stop 1.2780. Stop-Loss 1.2710. Take-Profit 1.2800, 1.2845, 1.2875, 1.2900, 1.2960, 1.3000, 1.3100


