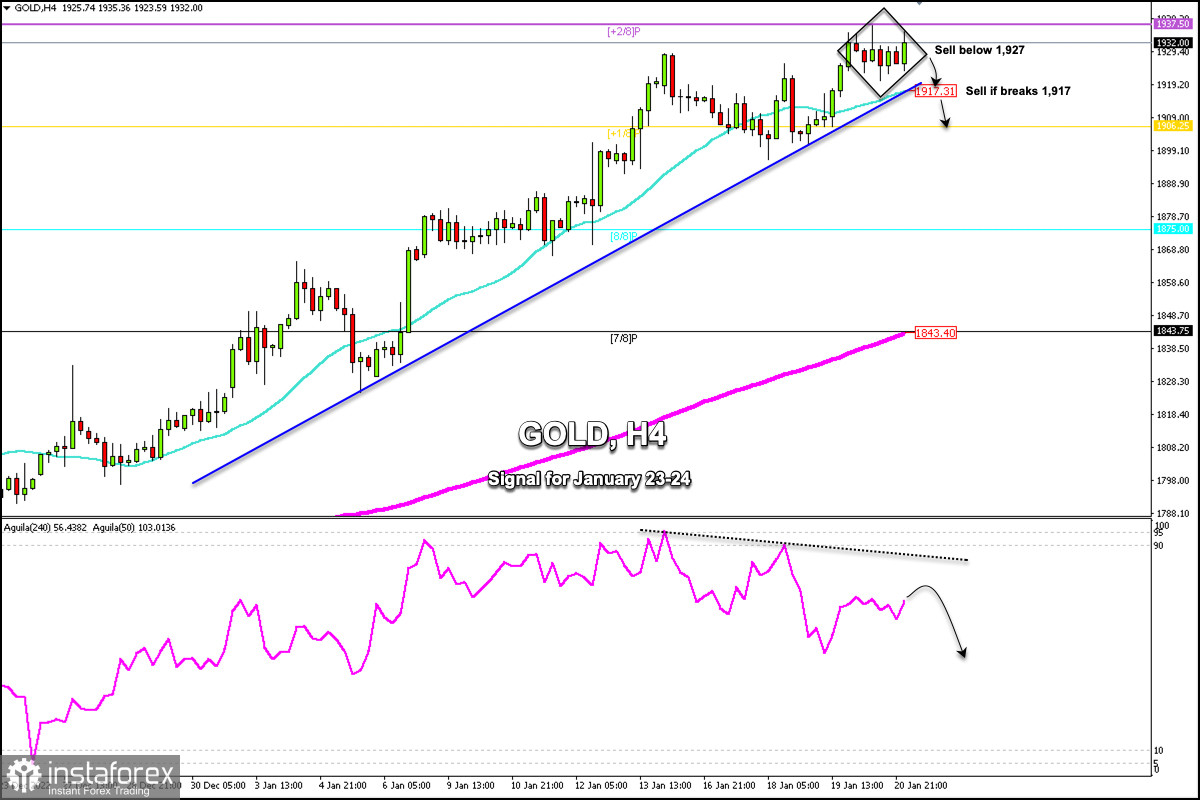
Early in the European session, Gold (XAU/USD) is trading around 1,932, below +2/8 Murray located at 1,937 and above the 21 SMA (1,917). We can see an accumulation in the latest Japanese candlesticks on the 4-hour chart, which could be a sign of exhaustion or a possible technical reversal.
The pivot point for today is located at 1,927. This area is the key. If gold falls below, it is likely that we can see a technical correction towards 1,917. If it breaks this level, we could even expect it to fall towards +1/8 Murray located at 1,906.
On the other hand, on the bullish side, gold should consolidate above 1,940, so we could expect a new bullish sequence which could push the price the level of 1,952 (R_3) and 1,960 (W_R2), daily and weekly resistance levels.
According to the 4-hour chart, we can see the formation of a diamond pattern. If gold trades below 1,927, the signal could be confirmed and the price could fall in the short term towards the psychological level of 1,900.
The market sentiment shows that there are 56% of operators who are buying gold and 44% are selling. This could be a clear sign that gold could have a technical correction in the coming days and the bullish cycle could resume again.
The eagle indicator is moving below a bearish slope. We should wait for the XAU/USD pair to show a clear signal to sell. For this, we should wait for a close below 1,927 on the 4-hour chart.
Our trading plan for the next few hours is to sell below 1,927 with targets at 1,917 and 1,906. In case there is a pullback to 1,937 and gold fails to consolidate above this level, it could be seen as an opportunity to sell.


