


Analysis of previous deals:
30M chart of the EUR/USD pair
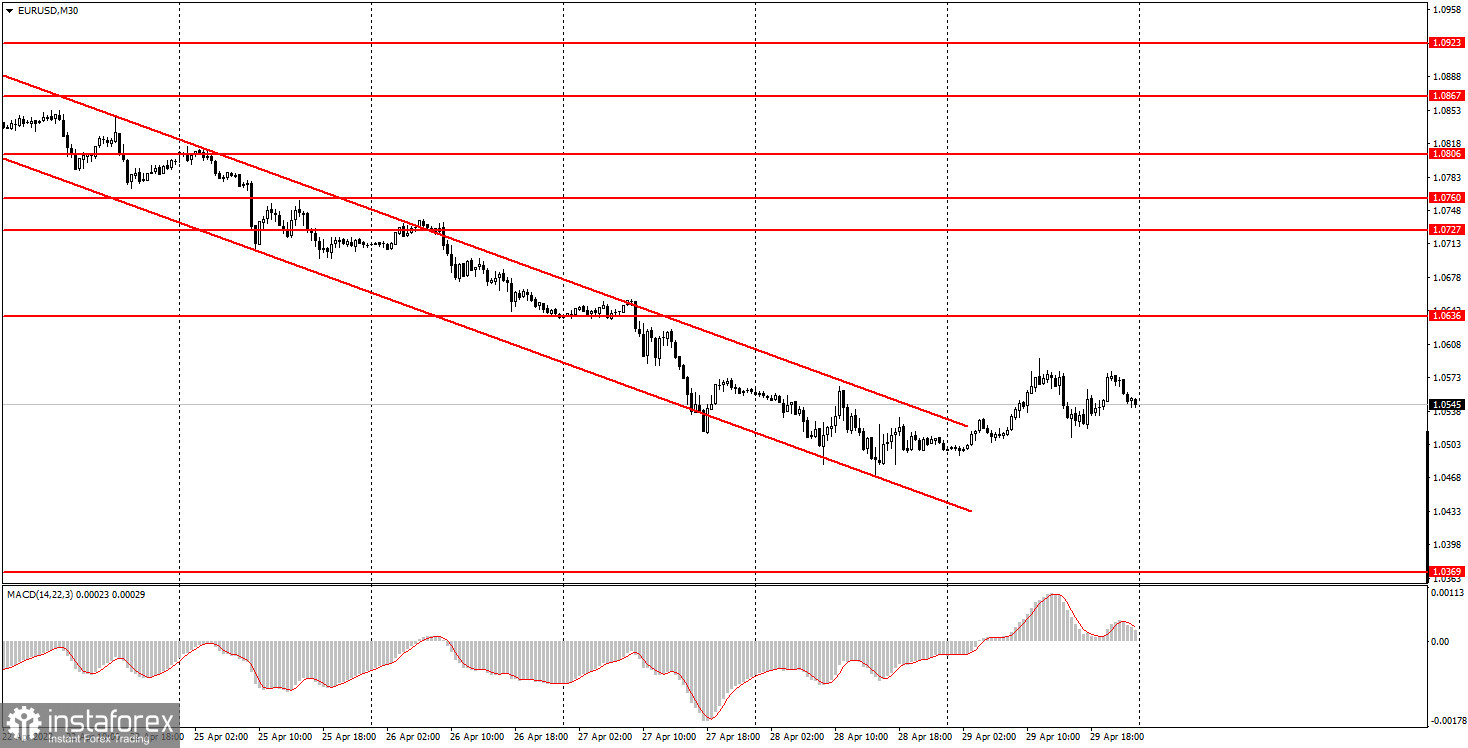
The EUR/USD currency pair finally began to adjust on Friday, having managed to leave the descending channel. We have already said that the channel is quite formal, since it is very narrow, so any correction will cause the price to leave it. That's exactly what happened on Friday. The correction has begun, but it does not mean that now the pair will begin to form a new upward trend. The European currency has sharply fallen in price over the past week and there is no reason to say that now the market will turn up and start buying euros. Therefore, we advise you to be wary of buying now. We remind you that all factors remain on the dollar's side. The euro currency, even with such a background, cannot become cheaper all the time, there should be corrections, but still it is very difficult and dangerous to identify a correction, try to catch it and make money on it now. After all, the downward trend is very strong. And on a downward trend, you need to sell, not buy. It should also be noted that at this time the pair has overcome its 5-year lows. That is, it has not been at the current levels for a very long time, therefore, there are few levels in this area near which signals can be formed. Macroeconomic statistics had no effect on the pair's movement on Friday, although important reports on GDP and inflation in the European Union were published..
5M chart of the EUR/USD pair
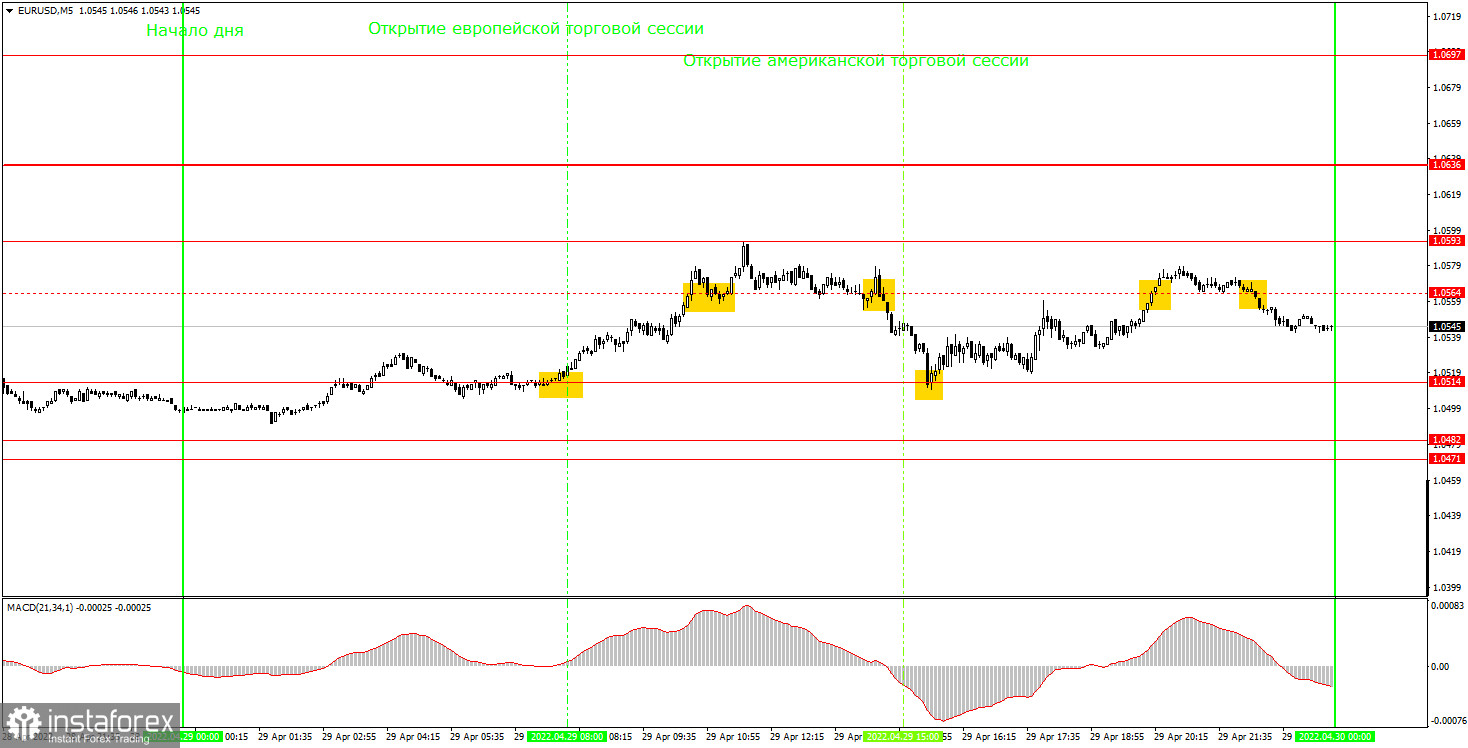
The technical picture looks good on a 5-minute timeframe. Several not-so-bad trading signals were generated during the day. Let's discuss. The first signal was formed right at the opening of the European trading session. The price overcame the 1.0514 level and went up 65 points, overcoming the 1.0564 level along the way. The 1.0593 level is Friday's high, and it was not present. Thus, it was necessary to close the long position on the next sell signal, which was formed after the price settled below 1.0564. At the same moment, it was necessary to open short positions. The price dropped back to the 1.0514 level and rebounded from it, which was a new buy signal. Therefore, we close the shorts and open new longs. After the formation of this signal, the price managed to rise again to the level of 1.0564, where it should have closed the deal. As a result, three deals were opened, all three turned out to be profitable. You could earn 60-70 points.
How to trade on Monday:
The trend remains downward on the 30-minute timeframe, despite the price leaving the descending channel. Thus, the euro's fall may resume as early as Monday, although we believe that the pair has already fallen quite heavily and it is time to adjust. On the 5-minute TF tomorrow, it is recommended to trade by levels 1.0369, 1.0471-1.0482, 1.0514, 1.0593, 1.0636, 1.0697. When passing 15 points in the right direction, you should set the Stop Loss to breakeven. The European Union will publish a report on business activity in the manufacturing sector for April. A similar index will be released in America. However, traders ignored much more important data last week, so we do not expect the market to react to these reports. Most likely, the market will move based on the mood, which is very difficult to predict in advance, so we trade by levels.
Basic rules of the trading system:
1) The signal strength is calculated by the time it took to form the signal (bounce or overcome the level). The less time it took, the stronger the signal.
2) If two or more deals were opened near a certain level based on false signals (which did not trigger Take Profit or the nearest target level), then all subsequent signals from this level should be ignored.
3) In a flat, any pair can form a lot of false signals or not form them at all. But in any case, at the first signs of a flat, it is better to stop trading.
4) Trade deals are opened in the time period between the beginning of the European session and until the middle of the American one, when all deals must be closed manually.
5) On the 30-minute TF, using signals from the MACD indicator, you can trade only if there is good volatility and a trend, which is confirmed by a trend line or a trend channel.
6) If two levels are located too close to each other (from 5 to 15 points), then they should be considered as an area of support or resistance.
On the chart:
Support and Resistance Levels are the Levels that serve as targets when buying or selling the pair. You can place Take Profit near these levels.
Red lines are the channels or trend lines that display the current trend and show in which direction it is better to trade now.
The MACD indicator (14,22,3) consists of a histogram and a signal line. When they cross, this is a signal to enter the market. It is recommended to use this indicator in combination with trend lines (channels and trend lines).
Important speeches and reports (always contained in the news calendar) can greatly influence the movement of a currency pair. Therefore, during their exit, it is recommended to trade as carefully as possible or exit the market in order to avoid a sharp price reversal against the previous movement.
Beginners on Forex should remember that not every single trade has to be profitable. The development of a clear strategy and money management are the key to success in trading over a long period of time.


