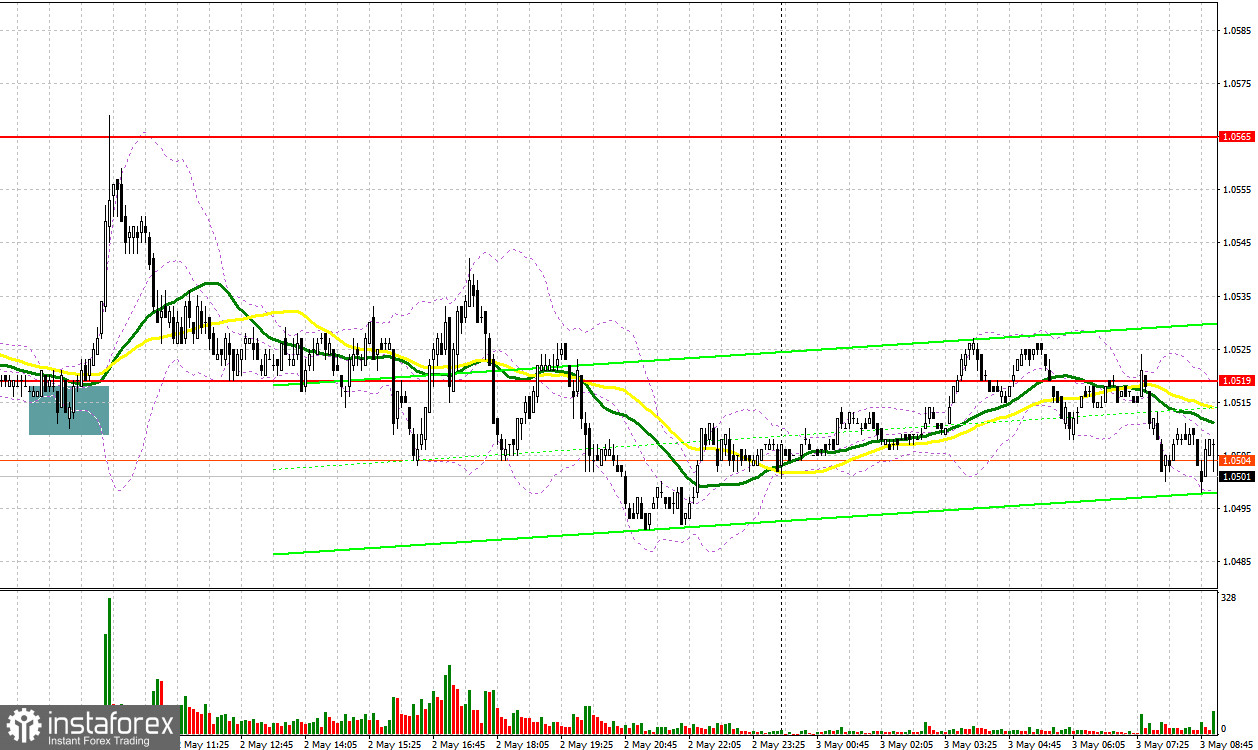
Yesterday, there was one good signal to buy the euro. Let's have a look at the 5-minute chart and discuss what happened there. The decline and the false breakout in the support area of 1.0519 formed a great signal to open long positions. As a result, the pair went up by more than 40 pips, reaching the nearest resistance at 1.0565. Although there was a false breakout, I could not open short positions from there with a convenient stop order. For this reason, I missed the entry point. Several false breakouts at the level of 1.0519 in the afternoon did not result in the resumption of the uptrend.

For long positions on EUR/USD:
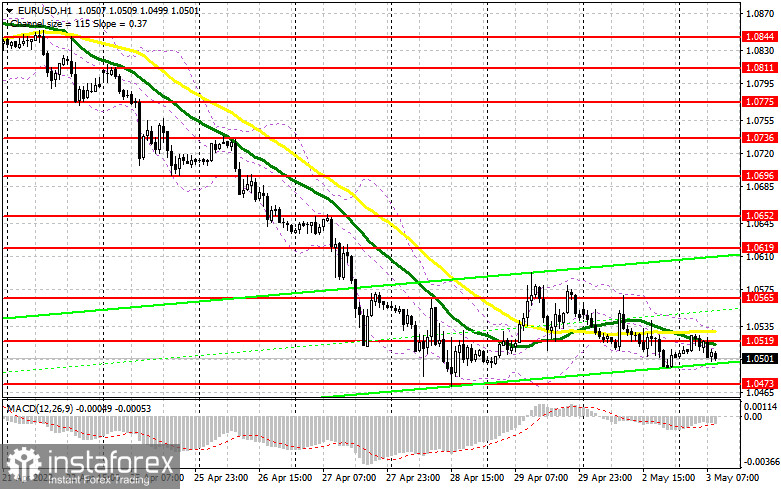
The main task for the bulls today is to protect this year's low at 1.0473, which the euro sellers have been looking at for a long time. Today, we expect a bunch of macroeconomic data in the eurozone and Germany, so the pressure on the European currency may resume. In case the unemployment data in Germany is weak and the eurozone producer price index and the eurozone unemployment rate are downbeat as well, the pair will quickly fall to 1.0473. You can buy the pair only after a false breakout, hoping that bulls will manage to regain ground. In the case of strong reports, we can expect the pair to recover back to 1.0519, where the moving averages supporting the sellers are located. A breakout and a test of 1.0519 from top to bottom will form a new signal for entering long positions. This will create an opportunity to return to the area of 1.0565, where I recommend taking profit. A more distant target will be the area of 1.0619. In the event of a decline in EUR/USD and low bullish activity at 1.0473, which is more likely ahead of tomorrow's Fed meeting, it is better to wait with purchases. The best scenario for buying the pair would be a false breakout near the new yearly low of 1.0426. You can open long positions on the euro immediately on a rebound from 1.0394, or even lower at 1.0347, keeping in mind an upward correction of 30-35 pips within the day.
For short positions on EUR/USD:
Sellers are still in control of the market. Yet, their strength is not enough to push the pair below 1.0473, especially ahead of tomorrow's Fed meeting. Be careful with going short on a breakout as you may find yourself in a very difficult situation. Obviously, the regulator will raise the rate by 0.5% tomorrow, so the further trajectory of the pair will depend on Powell's statements. They can trigger a new wave of growth in the US dollar and a fall in EUR/USD. So, bears now need to do their best to maintain control over the market. For this, they need to test yearly lows below 1.0473. Before that, sellers will also have to test the support at 1.0519, where the moving averages supporting the downtrend are located. The best scenario for opening short positions will be the formation of a false breakout at 1.0519. This will create the first sell signal and increase the pressure on the pair towards the next downward target at 1.0473. In case the macroeconomic data in the eurozone is weak, this level is likely to be the pivot point in the first half of the day. A breakout and consolidation below 1.0473, as well as a retest from the bottom up, will give a signal to sell the euro. This can eventually lead the price to yearly lows in the area of 1.0426 and 1.0394, where I recommend taking profit. A more distant target will be the area of 1.0347. However, such a scenario is possible only if the dollar bulls show action after the Fed meeting. If the euro rises in the first half of the day and there are no bears at 1.0519, I expect a sharper move to the upside. In this case, the best scenario would be to go short on a false breakout in the area of 1.0565. You can sell EUR/USD immediately on a rebound from 1.0619, or even higher at 1.0652, keeping in mind a possible downward correction of 25-30 pips.

COT report:
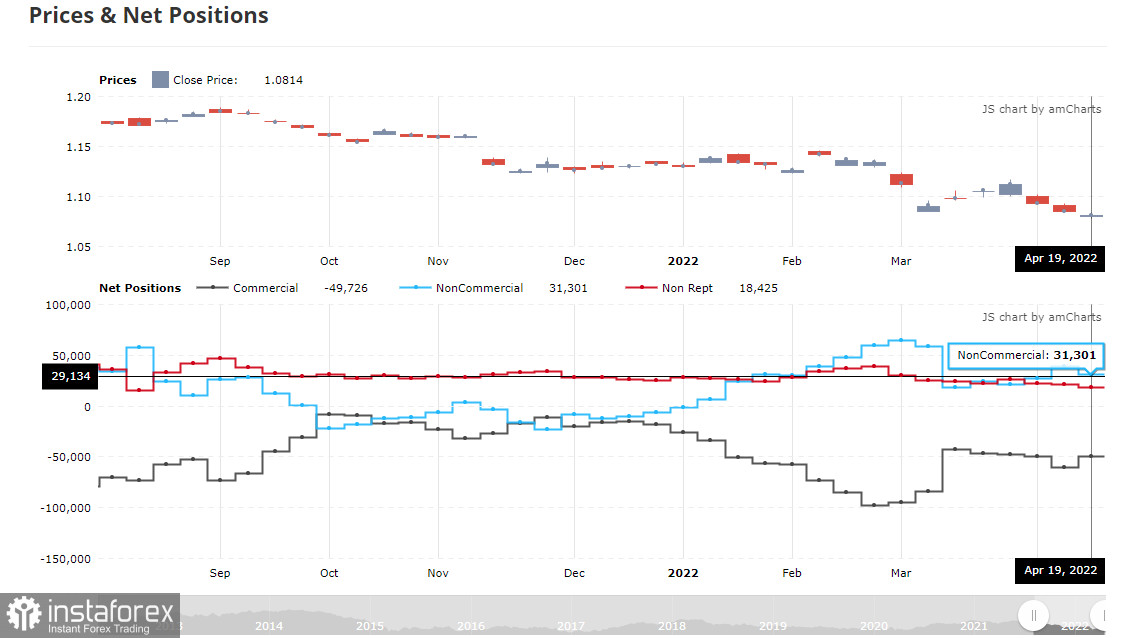
The COT report (Commitment of Traders) for April 19 recorded a sharp increase in short positions and a reduction in the long ones. Recent statements by some central bank officials triggered a sell-off in risk assets as everyone understands that Western countries will surely face serious economic challenges this year. The head of the European Central Bank noted that the regulator was planning to discontinue its bond buying program by the end of the second quarter of 2022 and hinted at a rate hike in early autumn. Yet, this was not enough to support the euro. On the other hand, a more aggressive policy of the US Federal Reserve and expectations of a 0.75% rate hike in May are the main factors that drive the US dollar. Markets also fear that severe quarantine restrictions in China due to the new wave of Covid-19 will paralyze the economy. The lockdown has already led to a massive disruption in the supply chains in Europe and Asia. So, the US dollar remains in high demand, pushing the EUR/USD pair down. Russia's new round of military actions in Ukraine and the lack of progress in peace talks also weigh on the euro and are likely to do so in the near term. The COT report shows that long positions of the non-commercial group of traders decreased from 221,645 to 221,003, while short positions rose sharply from 182,585 to 189,702. At the same time, a decline in the euro makes it more attractive to investors; therefore, the number of long positions is not surprising. As a result, the total non-commercial net position decreased and amounted to 34,055 against 39,060. The weekly closing price dropped sharply and stood at 1.0814 against 1.0855.

Indicator signals:
Moving Averages
Trading below the 30- and 50-day moving averages indicates uncertainty in the market.
Please note the time period and prices of moving averages are analyzed only for the H1 chart which differs from the general definition of the classic daily moving averages on the D1 chart.
Bollinger Bands
A breakout of the lower band at 1.0485 will lead to a new decline in the euro.
Description of indicators:
• A moving average determines the current trend by smoothing volatility and noise. 50-day period; marked in yellow on the chart
• A moving average determines the current trend by smoothing volatility and noise. 30-day period; marked in green on the chart;
• MACD Indicator (Moving Average Convergence/Divergence) Fast EMA, 12-day period; Slow EMA, 26-day period. SMA with a 9-day period;
• Bollinger Bands: 20-day period;
• Non-commercial traders are speculators such as individual traders, hedge funds, and large institutions who use the futures market for speculative purposes and meet certain requirements;
• Long non-commercial positions represent the total number of long position opened by non-commercial traders;
• Short non-commercial positions represent the total number of short position opened by non-commercial traders;
• The total non-commercial net position is the difference between short and long positions of non-commercial traders.


