


Analysis of Tuesday's trades:30M chart of GBP/USD
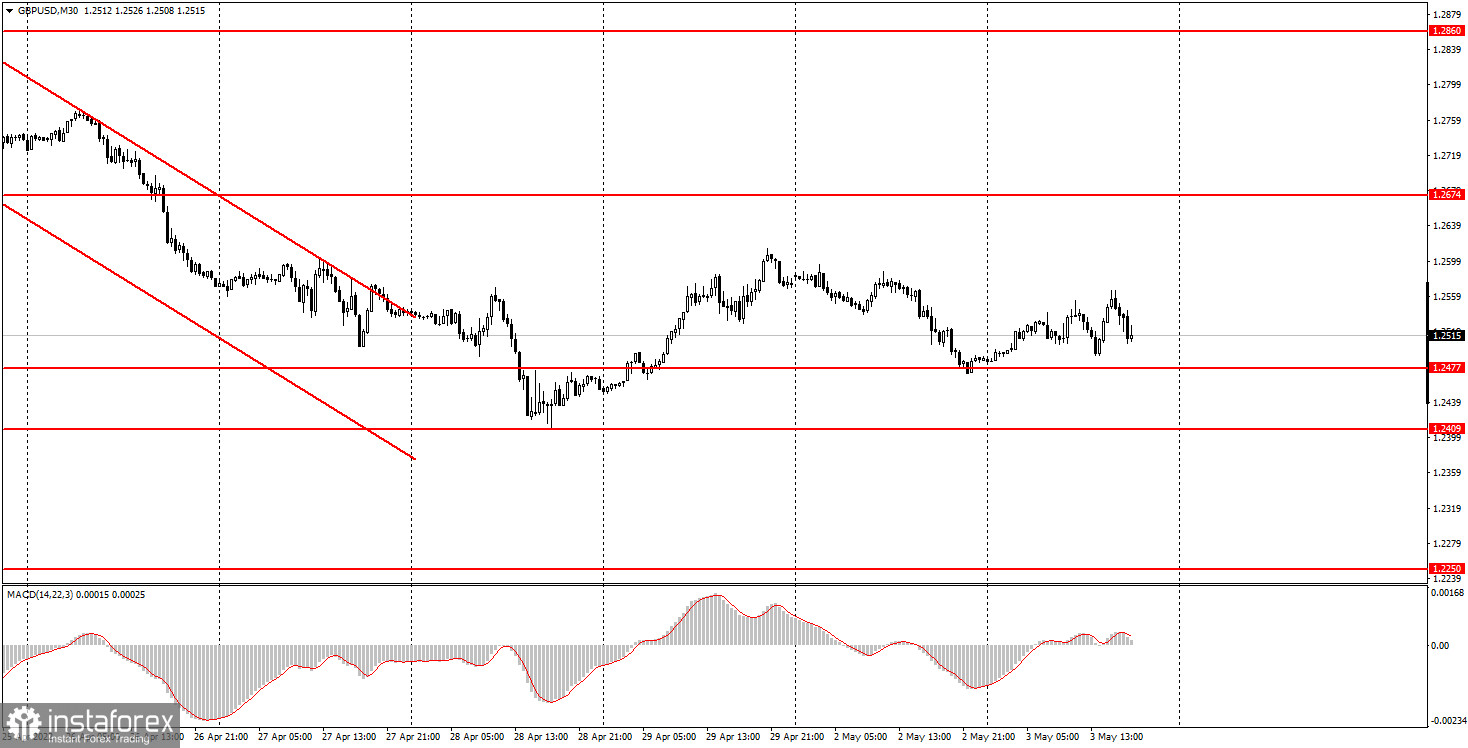
On Tuesday, no clear trend movement could be seen, and the volatility of GBP/USD was low – just about 80 pips. However, when the pair is almost flat, such volatility does not make trading easier. No important macro events unfolded either in the UK or in the US during the day. It also should be noted that GBP/USD is still hovering around its 2-yer lows. In other words, traders express little interest in buying the pair even when it stays so low. From the technical point of view, the euro and the pound move almost alike. Moreover, the factors affecting them are the same as well. Nevertheless, the pairs may trade mixed this week because the Bank of England's meeting will take place this Thursday. The pound may show nice trend movement already by the end of Wednesday. The US Federal Reserve is expected to announce a 50 basis points rate hike and start reducing the balance sheet. Traders also anticipate hawkish statements from Chairman Powell. If so, we may see the greenback ascending. Anyway, we should be prepared for any outcome.
5M chart of GBP/USD
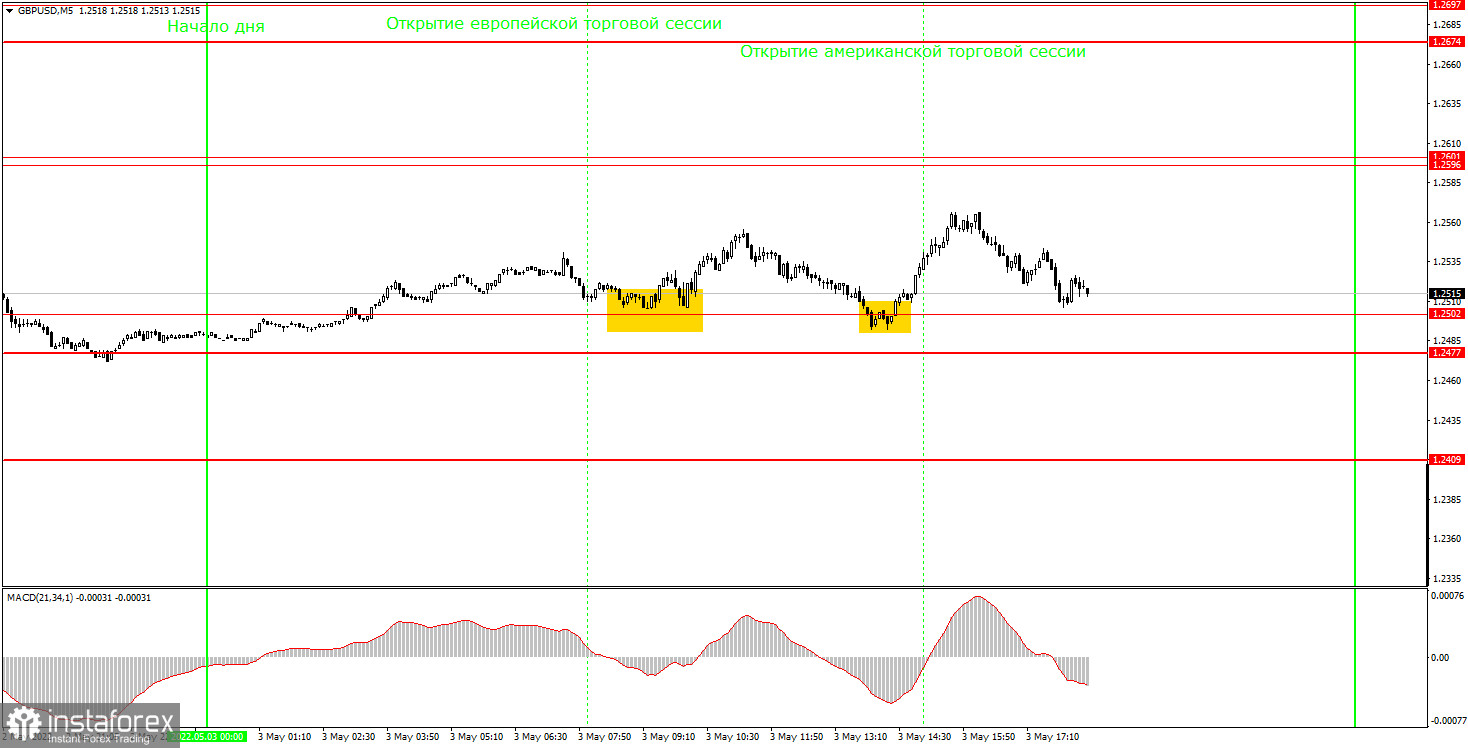
In the M5 time frame, the pair moved almost sideways on Tuesday. Taking into account the fact that there were not so many levels in the area where the pair traded, just a few trading signals were produced. This was actually a good thing because many false signals could have been made amid such a movement. Anyway, two buy signals were generated at around 1.2502. The pair went up by 34 pips after the first signal and another 48 pips after the second one. That is, in both cases, beginners were able to set Stop Loss at the breakeven point, which means no losses were incurred. In fact, they could have even made a profit by closing trades manually as the price never touched the nearest target level of 1.2601. So, we now should wait for the Bank of England's and the US Federal Reserve's meetings to pass to see the pair in a trend.
Trading plan for Wednesday:
In the 30M time frame, the downtrend continues. The pound has recently lost 600 pips retracing up slightly afterward. Therefore, the pound may extend/resume the downtrend at any moment. The fact that the pound needs to retrace up once in a while speaks in favor of the uptrend. Moreover, corrections should be in proportion to the trend movement. On Wednesday, the target levels in the 5M time frame are seen at 1.2409, 1.2477, 1.2502, 1.2596-1.2601, 1.2674, and 1.2697. A stop-loss order should be set at the breakeven point as soon as the price passes 20 pips in the right direction after a trade has been opened. The macroeconomic calendar in the UK contains no important releases on Wednesday. At the same time, in the US, the regulator will announce an interest rate decision, and Chairman Powell will hold a press conference. Given that these central events are set to unfold by the close of the trading day, you could also focus on the ADP and ISM reports in the US earlier during the day.
Basic principles of the trading system:
1) The strength of the signal depends on the time period during which the signal was formed (a rebound or a break). The shorter this period, the stronger the signal.
2) If two or more trades were opened at some level following false signals, i.e. those signals that did not lead the price to the Take Profit level or the nearest target levels, then any consequent signals near this level should be ignored.
3) During the flat trend, any currency pair may form a lot of false signals or produce no signals at all. In any case, the flat trend is not the best condition for trading.
4) Trades are opened in the time period between the beginning of the European session and until the middle of the American one when all deals should be closed manually.
5) We can pay attention to the MACD signals in the 30M time frame only if there is good volatility and a definite trend confirmed by a trend line or a trend channel.
6) If two key levels are too close to each other (about 5-15 pips), then this is a support or resistance area.
How to interpret charts:
Support and resistance levels can serve as targets when buying or selling. You can place Take Profit near them.
Red lines are channels or trend lines that display the current trend and show which direction is better to trade.
MACD indicator (14,22,3) is a histogram and a signal line showing when it is better to enter the market when they cross. This indicator is better to be used in combination with trend channels or trend lines.
Important speeches and reports that are always reflected in the economic calendars can greatly influence the movement of a currency pair. Therefore, during such events, it is recommended to trade as carefully as possible or exit the market in order to avoid a sharp price reversal against the previous movement.
Beginner traders should remember that every trade cannot be profitable. The development of a reliable strategy and money management is the key to success in long-term trading.


