


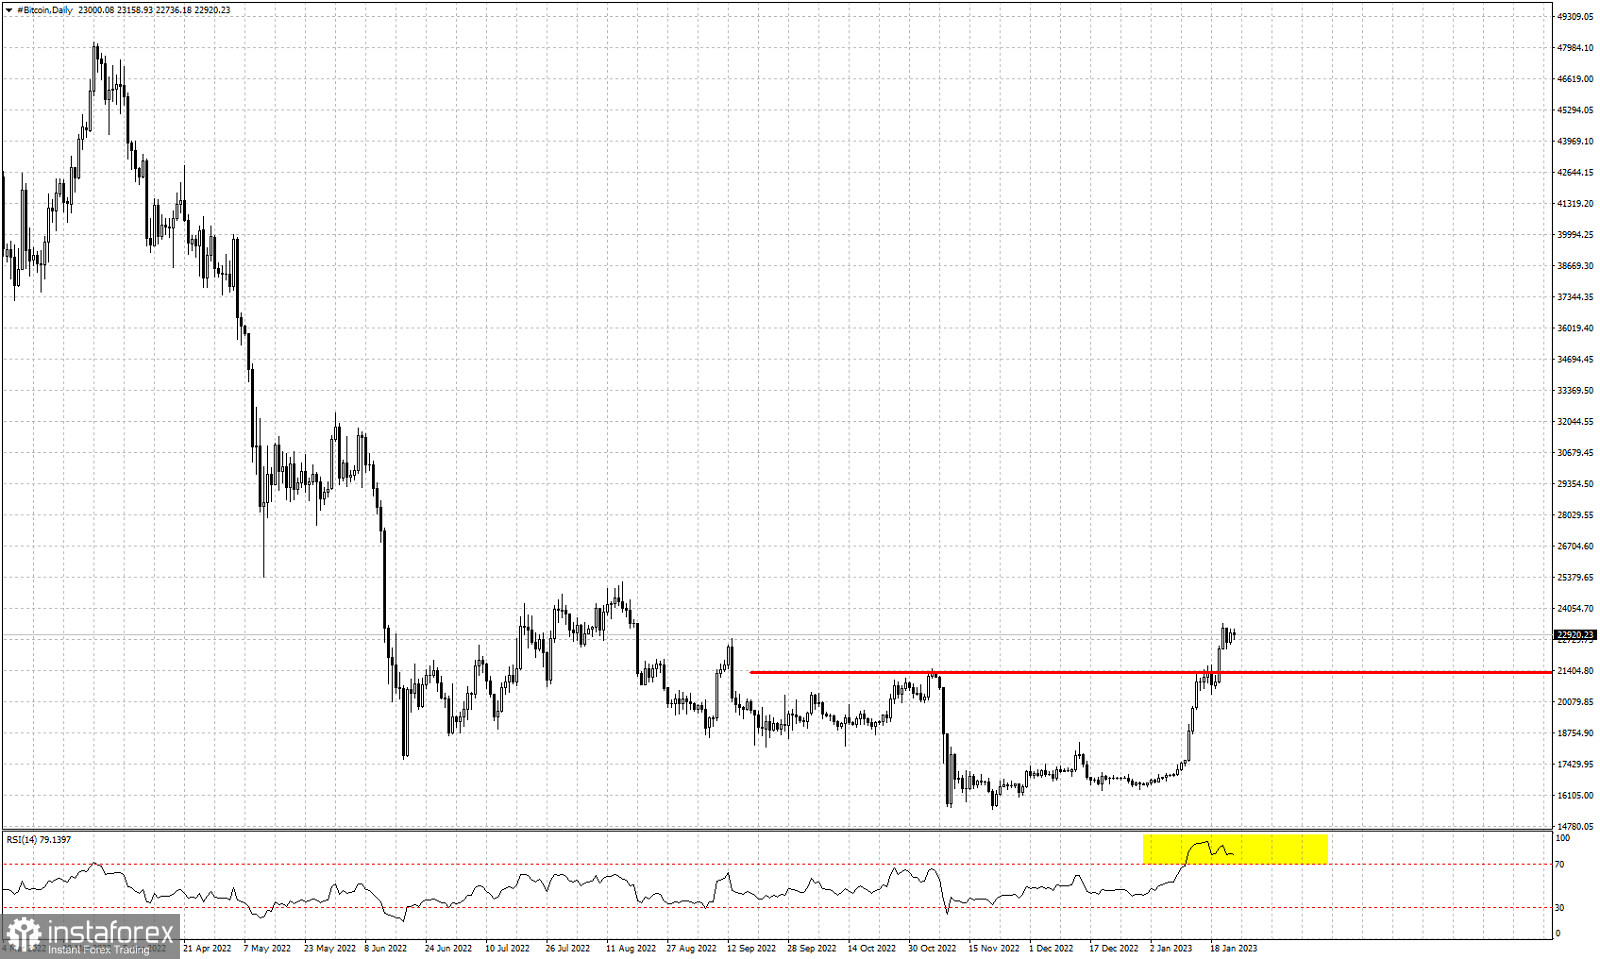
Red line -horizontal resistance (broken)
Yellow rectangle- overbought RSI
Bitcoin has recently broken above the short-term horizontal resistance at $21,400 and is now trading close to $23,000. Short-term trend remains bullish as price continues making higher highs and higher lows. On a daily basis the RSI has reached overbought levels and has started providing bearish divergence signals. The new higher high in price was not followed by a higher high in the RSI. This is only a warning and not a reversal signal. There are a lot of obstacles that bulls need to overcome in order to start talking about a trend change and not just a short-term bounce. As we mentioned in previous posts, current Bitcoin chart looks very similar to previous bottom and reversal. But it is too soon to tell if the new up trend has started. The new sequence of higher highs and higher lows is definitely a good sign for bulls.


