Hi, dear traders!
First, let us have a look at the pair's performance last week.
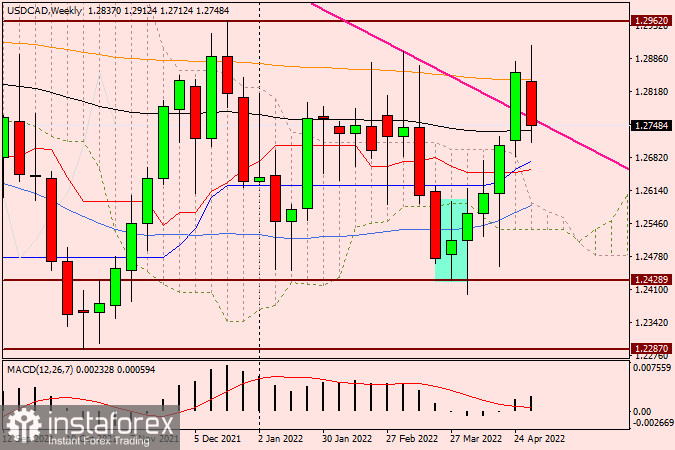
Weekly

USD/CAD advanced significantly last week, rising above the pink resistance level at 1.4667-1.2899 of the downward trend channel, as well as the orange 200-day EMA. At this point, the pair is under bearish pressure, forming a Harami reversal candlestick pattern. Tomorrow is set to be a very important day for the pair - both US and Canadian labor market data will be released on Friday. As a result, tomorrow's trading is likely to be highly volatile, and the data releases are set to determine the pair's trajectory. If USD/CAD manages to push above the latest highs and close in positive territory, it could extend the uptrend. If the quote returns below the resistance level, it would turn the breakout into a false one, indicating that the pair would likely to move down in the future.
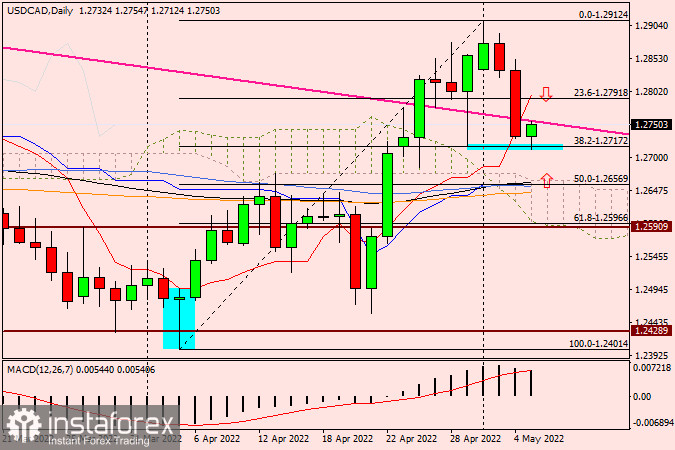
Daily

USD/CAD slumped after the Federal Reserve had increased the Fed funds rate by 75 basis points - market players possibly expected a 75 basis point hike from the regulator. According to the daily chart, the pair retreated below the pink resistance level at 1.4667-1.2899. USD/CAD has strong support near 1.2715 - at the time of writing, the pair bounced off the support level upwards, trying to regain lost ground. However, it is quite unlikely to do so due to the size of the pair's earlier drop.
If USD/CAD does manage to regain bullish momentum, it would again surpass the pink resistance line, with the red Tenkan-Sen line of the Ichimoku cloud at 1.2797 being its next target. Said line lies directly below the strong technical level of 1.2800. If the pair sinks below the low at 1.2712 and the key level of 1.2700, the pair could then slide down towards the upper boundary of the Ichimoku cloud at 1.2663. Below it lies several MA lines and the blue Kijun-Sen line - they could give support to the pair, allowing traders to open long positions. Short positions could be opened depending on USD/CAD's performance near 1.2800.
Good luck!


