


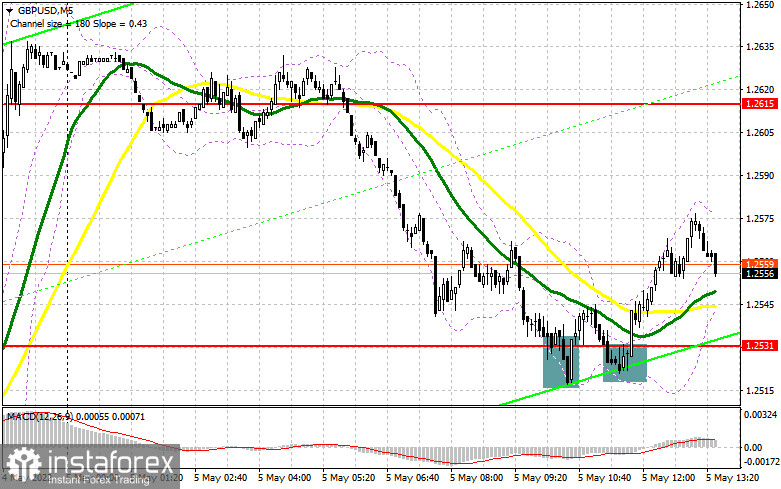
In my forecast this morning I drew your attention to the level of 1.2531 and recommended entering the market from it. Let's have a look at the 5-minute chart and analyze what happened. A decline and a false breakout at 1.2531 were expected in the first half of the day. If you did not open long positions, you could have done it in the case of the second unsuccessful attempt of bears to break below 1.2531. As a result, the pair increased by almost 45 pips, after which the demand for the pound decreased. Investors are waiting for the results of the Bank of England meeting, so no one will risk in the current situation.
Long positions on GBP/USD:
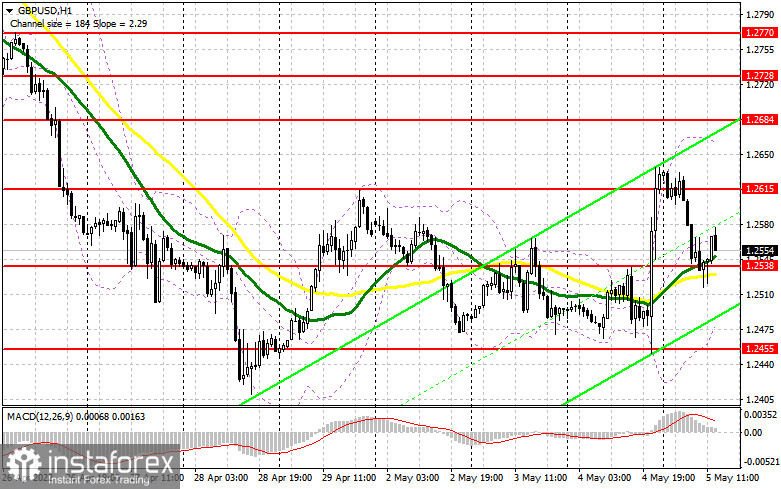
The Bank of England is expected to raise the rate by 25 basis points at once to 1.0% today. Recently, BoE Governor Andrew Bailey said that the regulator was on a difficult path, maneuvering between economic growth and inflation. Bailey also said that he might consider further staggered tightening, rather than following the US Federal Reserve's example considering a 50 basis point hike. If this comes true, the pressure on the pound is likely to increase in the afternoon, so be very careful with buying the currency. Therefore, the technical picture was changed. In case of another decline in the GBP/USD pair, it is better to pay attention to the level of 1.2538. Only the formation of a false breakout at this level along with weak jobless claims data in the US may result in a buy signal, counting on the continuation of the upward correction and return to 1.2615. It is possible to expect a sharper rally, but only after the meeting of the Bank of England and if Andrew Bailey showed a more aggressive approach to the monetary policy. If the market triggers stop-loss orders above 1.2615 and tests this level top/bottom, it may create a buy signal with the target of correction to the area of 1.2684. If the price fixes above this level, it is likely to reach high at 1.2728 and 1.2770, where traders may lock in profits. In case of a decline in the pound and buyers showing weak activity at 1.2538, which is more likely, it is better to postpone opening longs until the pair touches the next support at 1.2455. It is also better to enter the market there only if a false breakout is formed. You can buy the pair on a rebound from a low of 1.2381, or lower near 1.2321, allowing an intraday correction of 30-35 pips.
Short positions on GBP/USD:
Bears are gradually regaining control over the market, and the results of the Bank of England meeting may ruin buyers' hopes for an upward correction. If the GBP/USD pair rises during the US session after the weak US data and the Governor of the Bank of England's press conference, bears should do their best to keep the pair above 1.2615. A false breakout at this level will create a good sell signal. You can also count on a breakthrough of 1.2538, which is a new support level formed in the afternoon. A breakthrough and a bottom/top test of this level may create an additional sell signal, which is likely to push the pound down to the area of 1.2455, where traders may take profit. The next target is located in the area of 1.2381, however, this scenario is only relevant if Andrew Bailey's rhetoric appears to be dovish. If the pair continues to rise and there is weak activity at 1.2615, there can be a new surge because stop-loss orders will be triggered. In that case, it would be better to postpone opening short positions until the price hits resistance at 1.2684. Traders may also open short positions at that level only in case of a false breakout. If you want to sell the GBP/USD on the rebound, you can do it from 1.2728, allowing a downward intraday correction of 30-35 pips.
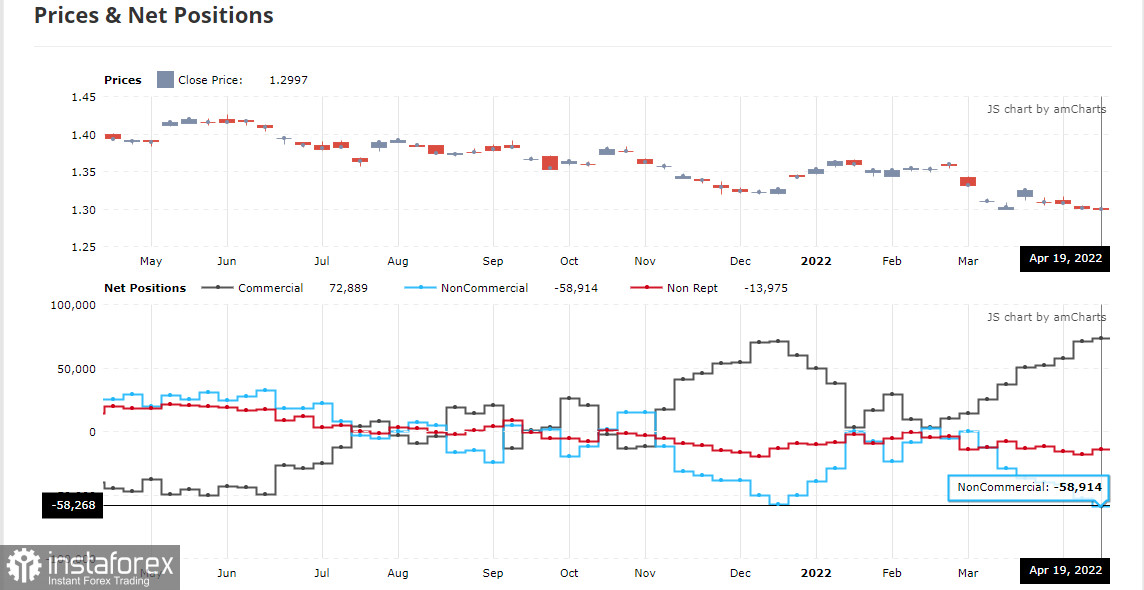
The COT report (Commitment of Traders) for April 19 logged an increase in both short and long positions. However, the long ones prevailed in number. It was expected and the chart confirms this. The US economy is weak and Governor Andrew Bailey confirmed this last week. His statements that the economy was moving towards recession kept the sellers of the pound in the second half of April. As a result, the breakthrough of the low and a new major sell-off in the pound has already driven the pair below the 1.2600, and it seems that this is not the end. The growth of the consumer price index goes to double-digit rates, and the complicating situation in the world because of the disruptions in supply chains in the background of a new wave of Covid-19 in China creates more problems. The situation will only get worse, as future inflation risks are now quite difficult to assess also because of the difficult geopolitical situation, but it is clear that the consumer price index will continue to rise in the coming months. The situation in the UK labor market, where employers have to fight for every worker by offering ever higher wages, also pushes inflation higher and higher. The Bank of England's interest rate decision could weaken the pound even further if Governor Andrew Bailey decides not to take serious action to combat inflationary pressures. The COT report for April 19 indicated that long non-commercials rose to 36,811 from 35,514, while short non-commercials jumped to 95,727 from 88,568. This led to an increase in the negative nonprofit net position to -58,268 from -53,054. The weekly closing price dropped to 1.2997 from 1.3022.
Moving averages
The pair is trading near the 30- and 50-day moving averages, indicating bears' attempt to return to the market.Note: Period and prices of moving averages are considered by the author on hourly chart H1 and differ from the general definition of classic daily moving averages on daily chart D1.Bollinger Bands
If the price declines, the bottom line of the indicator at 1.2500 will act as support.
Indicators description
- Moving average defines the current trend by smoothing out volatility and noise. Period 50. Marked in yellow.
- Moving average defines the current trend by smoothing out volatility and noise. Period 30. Marked in green.
- MACD (Moving Average Convergence/Divergence) indicator. Fast EMA period 12. Slow EMA period 26. SMA period 9
- Bollinger Bands. Period 20
- Non-commercial traders are speculators, such as individual traders, hedge funds, and large institutions, which use the futures market for speculative purposes and meet certain requirements.
- Long non-commercial positions represent the total long open position of non-commercial traders.
- Short non-commercial positions represent the total short open position of non-commercial traders.
- Total non-commercial net position is the difference between short and long positions of non-commercial traders.


