


Analysis of previous deals:
30M chart of the EUR/USD pair
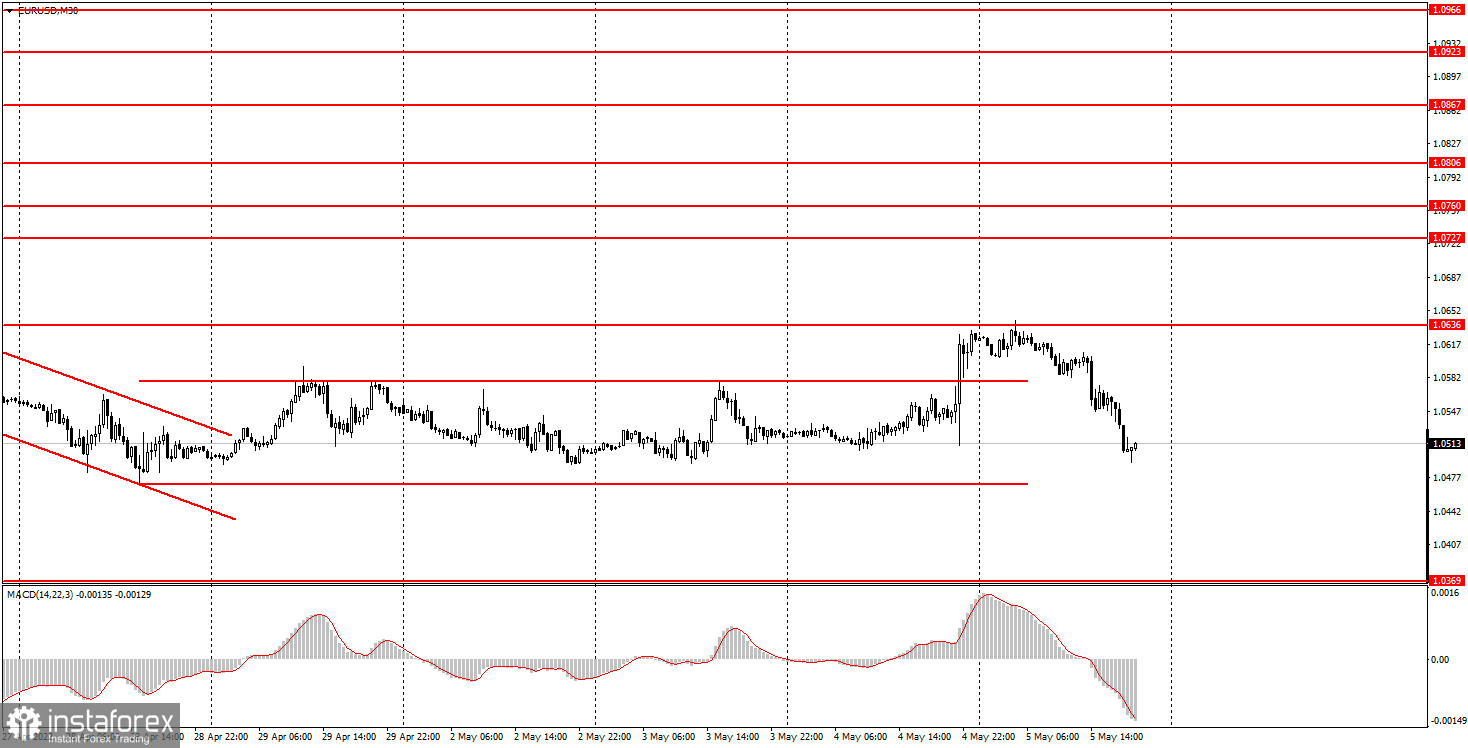
The EUR/USD currency pair showed a new powerful fall on Thursday. In yesterday's article, we talked about the fact that the pair can move absolutely unpredictably after the Federal Reserve meeting, and the development of its results will continue not only on Wednesday evening, but also throughout Thursday. As you can see, we were right. Yesterday, the European currency rose to the level of 1.0636, rebounded from it and today it fell by 140 points. Moreover, not a single important report was published either in the US or in the European Union, so such a strong drop could absolutely not have been caused by Thursday's events. Consequently, the markets continued to work out the results of the Fed meeting, which turned out to be hawkish, so they should have provoked the dollar's growth. Yesterday, it did not rise, but today it did, both on Wednesday and Thursday. The Fed raised its key rate to 1% and also announced a 0.5% increase in June and July. Thus, the central bank's position in the matter of monetary policy is now very aggressive. This should support the greenback and today it has sharply risen in price. The pair left the horizontal channel, but the downward trend is still preserved, which is perfectly visible on any higher timeframe.
5M chart of the EUR/USD pair
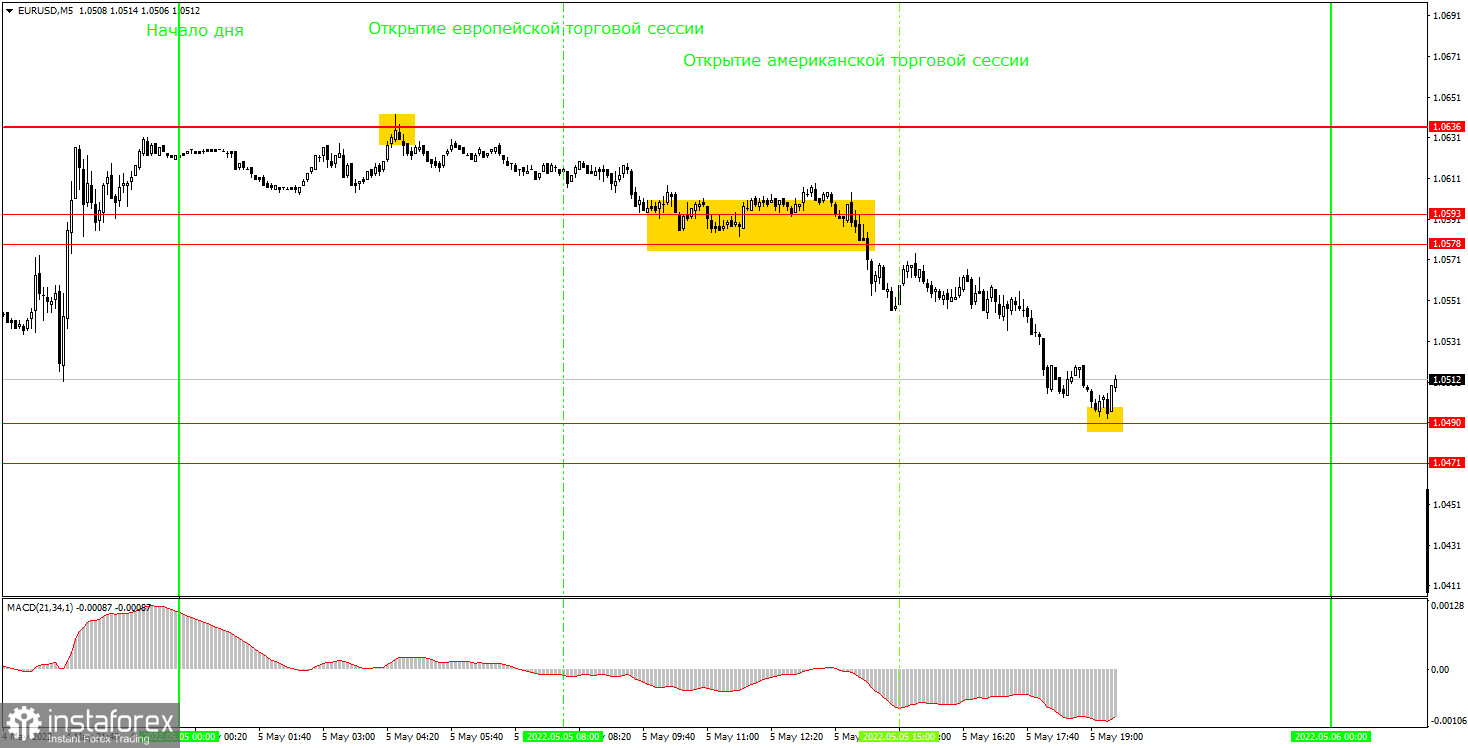
The technical picture looks very good on the 5-minute timeframe. Throughout the day, there was a trend movement, which was interrupted by macroeconomic statistics. The fall began at night from the level of 1.0636. However, for obvious reasons, novice traders missed this signal - it formed at night. The next signal had to wait quite a long time, and it turned out to be extremely inaccurate, as the pair took several hours to overcome the levels 1.0593 and 1.0578. However, it was still a sell signal that could have been worked out. After its formation, the price went down about 80 points and reached the level of 1.0490 (with a small error). Therefore, in total, it was possible to earn about 60 points on a short position. The signal to buy near the level of 1.0490 should not have been worked out, as it was formed too late.
How to trade on Friday:
The trend remains downward on the 30-minute timeframe despite the price leaving the descending channel and the horizontal channel. The entire downward trend has not been placed on the chart for a long time, but this does not mean that it no longer exists. The movement in the last 24 hours was very strong, but the pair did not manage to correct normally after the previous fall. The rise ended very quickly around the 1.0636 level. Now the euro may resume falling to its 20-year lows. On the 5-minute TF tomorrow it is recommended to trade at the levels of 1.0369, 1.0471-1.0490, 1.0578-1.0593, 1.0636, 1.0697. When passing 15 points in the right direction, you should set Stop Loss to breakeven. There will be no important reports and events in the European Union on Friday. But the most important reports on unemployment, wages and NonFarm Payrolls will be published in the US. It is the last report that is the most important, and the reaction to it can be very strong. Thus, most likely, another volatile day awaits us. If the US data turn out to be better than forecasts, then the dollar may continue to grow (the euro/dollar pair's decline).
Basic rules of the trading system:
1) The signal strength is calculated by the time it took to form the signal (bounce or overcome the level). The less time it took, the stronger the signal.
2) If two or more deals were opened near a certain level based on false signals (which did not trigger Take Profit or the nearest target level), then all subsequent signals from this level should be ignored.
3) In a flat, any pair can form a lot of false signals or not form them at all. But in any case, at the first signs of a flat, it is better to stop trading.
4) Trade deals are opened in the time period between the beginning of the European session and until the middle of the American one, when all deals must be closed manually.
5) On the 30-minute TF, using signals from the MACD indicator, you can trade only if there is good volatility and a trend, which is confirmed by a trend line or a trend channel.
6) If two levels are located too close to each other (from 5 to 15 points), then they should be considered as an area of support or resistance.
On the chart:
Support and Resistance Levels are the Levels that serve as targets when buying or selling the pair. You can place Take Profit near these levels.
Red lines are the channels or trend lines that display the current trend and show in which direction it is better to trade now. The MACD indicator (14,22,3) consists of a histogram and a signal line. When they cross, this is a signal to enter the market. It is recommended to use this indicator in combination with trend lines (channels and trend lines).
Important speeches and reports (always contained in the news calendar) can greatly influence the movement of a currency pair. Therefore, during their exit, it is recommended to trade as carefully as possible or exit the market in order to avoid a sharp price reversal against the previous movement.
Beginners on Forex should remember that not every single trade has to be profitable. The development of a clear strategy and money management are the key to success in trading over a long period of time..


