


Trend analysis (Fig. 1).
The euro-dollar pair may move down from the level of 1.0540 (close of yesterday's daily candle) to 1.0511, the 76.4% retracement level (blue dotted line). After testing this level, the price may move upward with the target of 1.0575, the 14.6% retracement level (red dotted line).
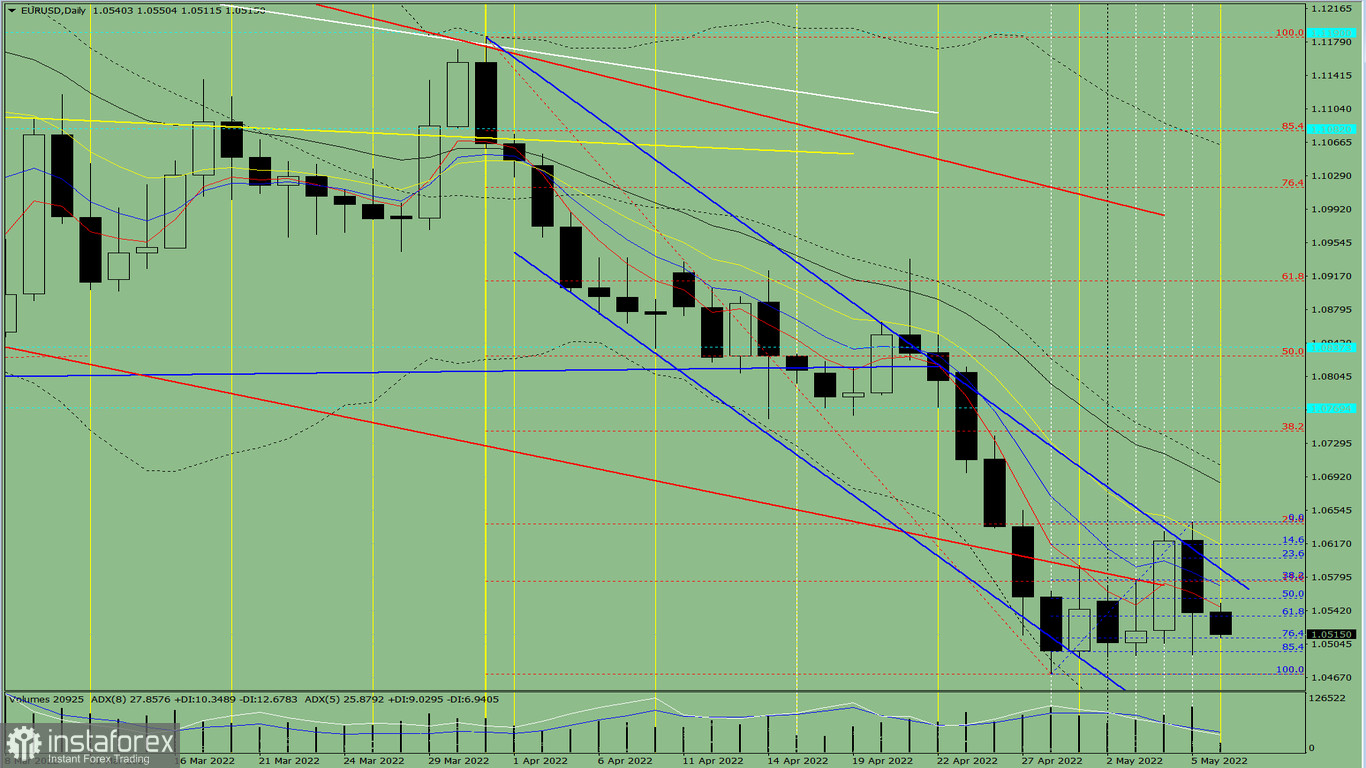
Fig. 1 (daily chart).
Comprehensive analysis:
- Indicator analysis – down;
- Fibonacci levels – up;
- Volumes – up;
- Candlestick analysis – up;
- Trend analysis – up;
- Bollinger bands – up;
- Weekly chart – up.
Today, the price may move down from the level of 1.0540 (close of yesterday's daily candle) to 1.0511, the 76.4% retracement level (blue dotted line). After testing this level, the price may move upward with the target of 1.0575, the 14.6% retracement level (red dotted line).
Alternative scenario: from the level of 1.0540 (close of yesterday's daily candle), the price may move down to 1.0496, the 85.4% retracement level (blue dotted line). After testing this level, the price may move up with the target of 1.0575, the 14.6% retracement level (red dotted line).

