


Trend analysis (Fig. 1).
The pound-dollar pair may down from the level of 1.2355 (close of yesterday's daily candle) to the lower fractal at 1.2324 (red dotted line). After testing this level, the price may start moving up with the target of 1.2463, the 14.6% retracement level (red dotted line).
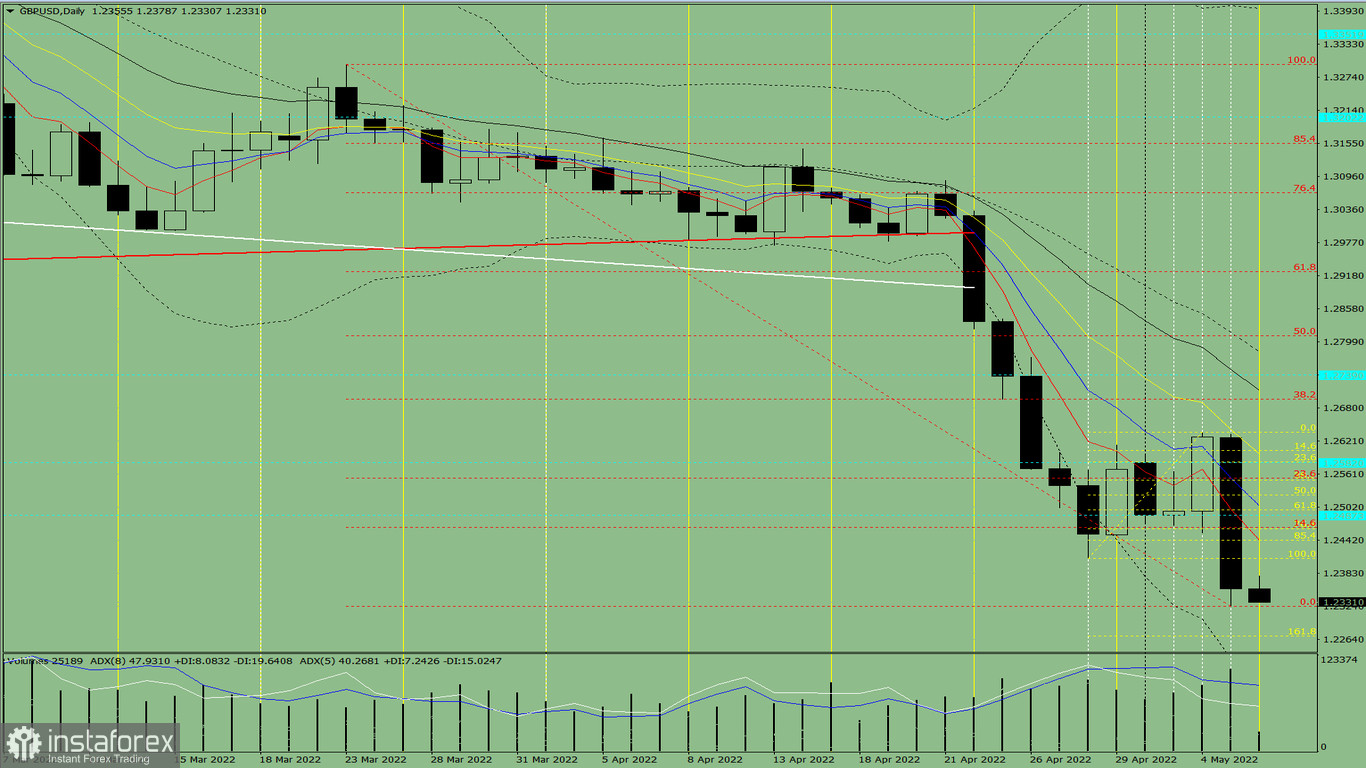
Fig. 1 (daily chart).
Comprehensive analysis:
- Indicator analysis – up;
- Fibonacci levels – up;
- Volumes – up;
- Candlestick analysis – up;
- Trend analysis – up;
- Bollinger bands – up;
- Weekly chart – up.
Today, the price may move down from the level of 1.2355 (close of yesterday's daily candle) to the lower fractal at 1.2324 (red dotted line). After testing this level, the price may start moving up with the target of 1.2463, the 14.6% retracement level (red dotted line).
Alternative scenario: from the level of 1.2355 (close of yesterday's daily candle), the price may move down to 1.2270, the 161.8% Fibonacci retracement level (yellow dotted line). After testing this level, the price may start moving up with the target of 1.2463, the 14.6% retracement level (red dotted line).

