


EUR/USD 5M
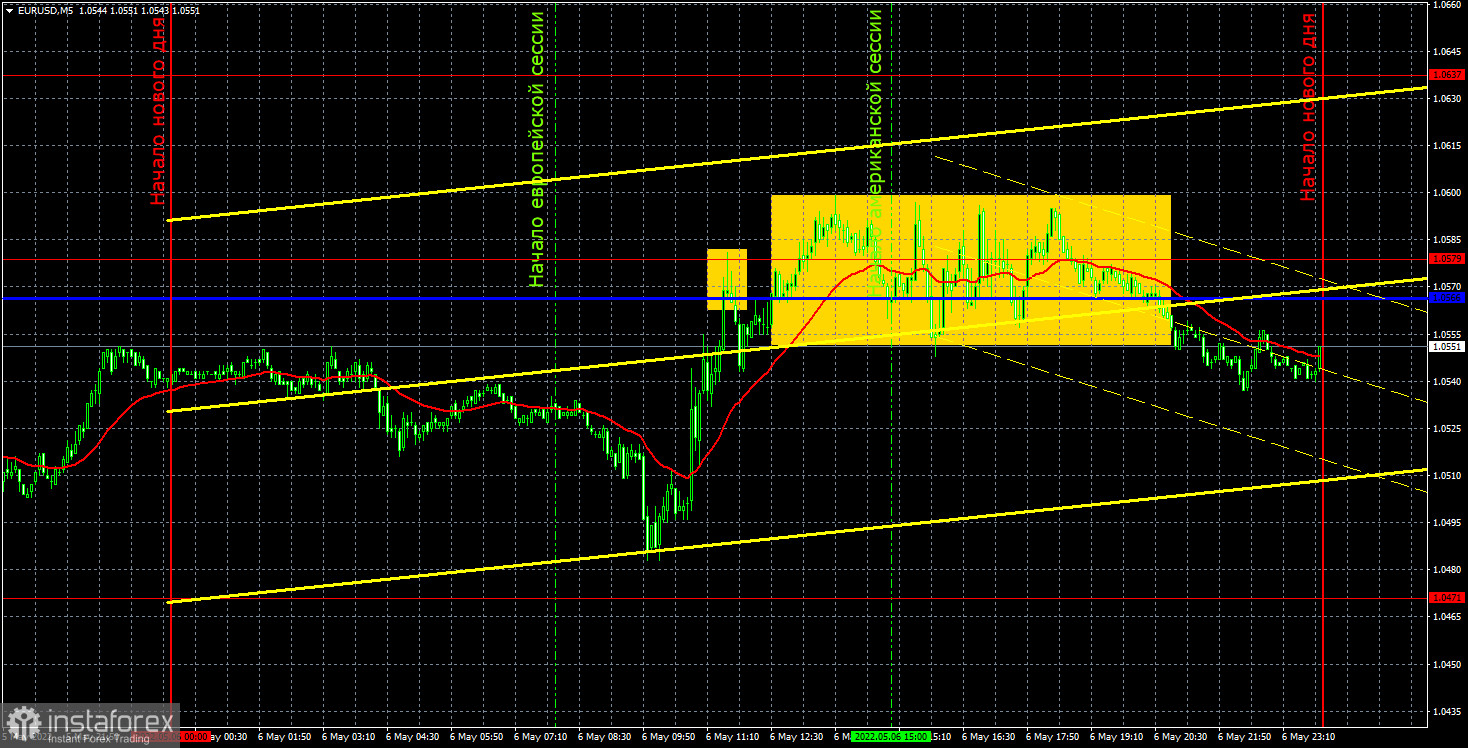
The EUR/USD pair made another attempt to correct last Friday. As before, it was unsuccessful. This time the pair only reached the level of 1.0579 and turned down again. Thus, for more than a week, the euro currency has been close to its 5-year lows, and the current local low is 1.0471. Recall that 20-year lows are located at 1.0350, so in the coming weeks the European currency may set a new anti-record value against the dollar. There were several interesting macroeconomic events on Friday. Of course, the most important was the NonFarm Payrolls report in the US, which always provokes a strong market reaction. However, not this time. This time, the dollar has risen in price by only a few tens of points on a fairly strong report on the labor market. The number of Nonfarms was 428,000, which is really a lot. Recall that in pre-crisis times, the value of 200-250,000 new jobs was considered normal. Now, with such a high value of Nonfarms, the unemployment rate is also extremely low - only 3.6%. That is, in the United States, the risk of a shortage of labor is really high, which is also not good for the economy.
There were trading signals on Friday, but it would be better not to have them. Since the pair has been in an absolutely inadequate movement for more than a week, which absolutely cannot be called a trend, and which looks very badly like a flat, the same incomprehensible signals are formed. For the first time, the pair rebounded from the level of 1.0579, which could be interpreted as a signal to sell, but the price went down 15 points with grief in half, which made it possible to set Stop Loss to breakeven, at which the deal was closed. Then "songs and dances" began near the Kijun-sen line and the level of 1.0579, which the price overcame every half an hour. Therefore, on any signal in this area, one could open another deal, which turned out to be 100% unprofitable, after which it was necessary to stop trading, since there were already two false signals in this area.
COT report:
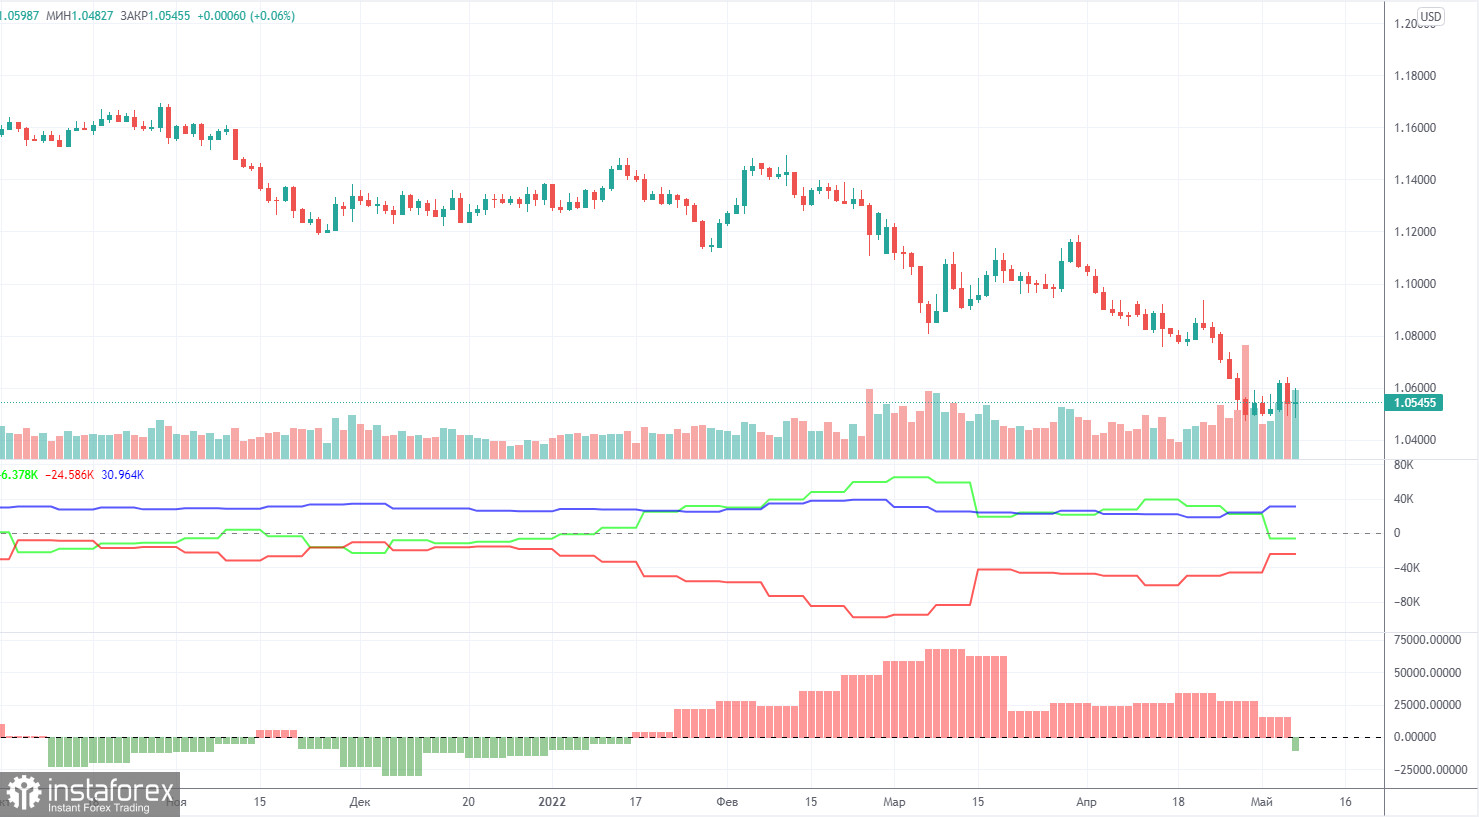
The latest Commitment of Traders (COT) reports on the euro raised more questions than they answered! But finally the situation began to change and now the COT reports more or less reflect the real picture of what is happening on the market, as the mood of the non-commercial group has become bearish. The number of long positions decreased by 14,500 during the reporting week, while the number of shorts in the non-commercial group increased by 14,000. Thus, the net position decreased by 28,500 contracts per week. This means that the bullish mood has changed to bearish, as the number of short positions now exceeds the number of non-commercial traders' long positions by 6,000. However, what happened in the last reporting week is a double-edged sword. On the one hand, COT reports now reflect what is happening on the market. On the other hand, if now the demand for the euro has also begun to fall, then we can expect another new fall in this currency. Recall that in recent weeks, professional traders, oddly enough, maintained a bullish mood and bought the euro more than sold. And even in this scenario, the euro fell like a stone. What will happen now, when the major players have begun to sell the euro? Demand for the dollar remains high, demand for the euro falls. Thus, it is quite reasonable now to expect a new decline in the euro/dollar pair. Moreover, the reaction to the Federal Reserve's hawkish meeting was not quite adequate.
We recommend to familiarize yourself with:
Overview of the EUR/USD pair. May 9. Geopolitics promises to be very difficult in the coming weeks.
Overview of the GBP/USD pair. May 9. The British pound is falling again, there are few hopes for salvation.
Forecast and trading signals for GBP/USD on May 9. Detailed analysis of the movement of the pair and trading transactions.
EUR/USD 1H
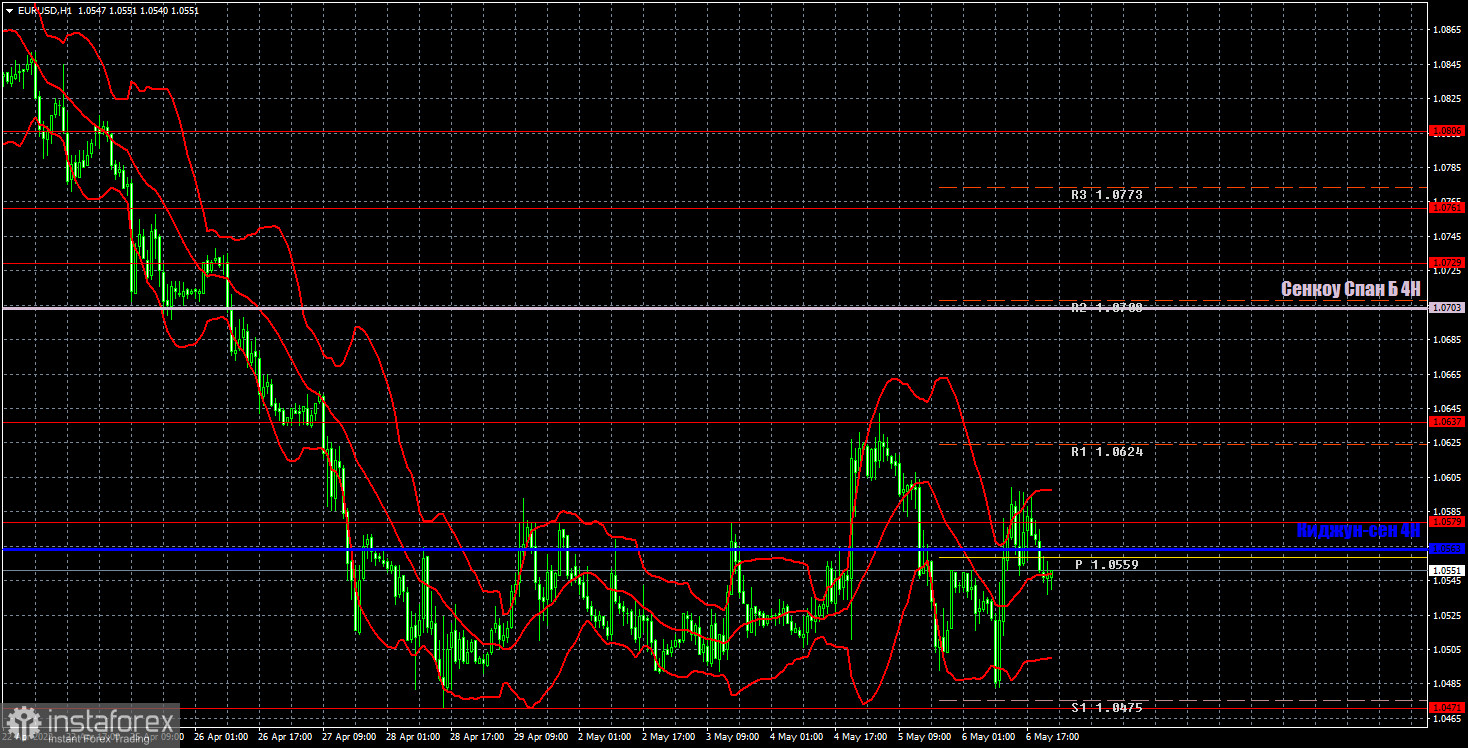
It is clearly visible on the hourly timeframe that the pair has been desperately trying to correct in recent weeks. You can also clearly see the "inadequate" movement that we talked about above. In fact, the price moves sideways, but not inside the horizontal channel, which only complicates the trading process. And yet the downward trend continues. On Monday, we highlight the following levels for trading - 1.0340-1.0369, 1.0471, 1.0579, 1.0637, 1.0729, as well as Senkou Span B (1.0703) and Kijun-sen (1 .0563). Ichimoku indicator lines can move during the day, which should be taken into account when determining trading signals. There are also secondary support and resistance levels, but no signals are formed near them. Signals can be "rebounds" and "breakthrough" extreme levels and lines. Do not forget about placing a Stop Loss order at breakeven if the price has gone in the right direction for 15 points. This will protect you against possible losses if the signal turns out to be false. No important events or publications are scheduled for May 9 in the European Union and the United States. Thus, there will be nothing for traders to react to. Perhaps Rafael Bostic will tell the markets something important, but hopes for this are small.
Explanations for the chart:
Support and Resistance Levels are the levels that serve as targets when buying or selling the pair. You can place Take Profit near these levels.
Kijun-sen and Senkou Span B lines are lines of the Ichimoku indicator transferred to the hourly timeframe from the 4-hour one.
Support and resistance areas are areas from which the price has repeatedly rebounded off.
Yellow lines are trend lines, trend channels and any other technical patterns.
Indicator 1 on the COT charts is the size of the net position of each category of traders.
Indicator 2 on the COT charts is the size of the net position for the non-commercial group.


