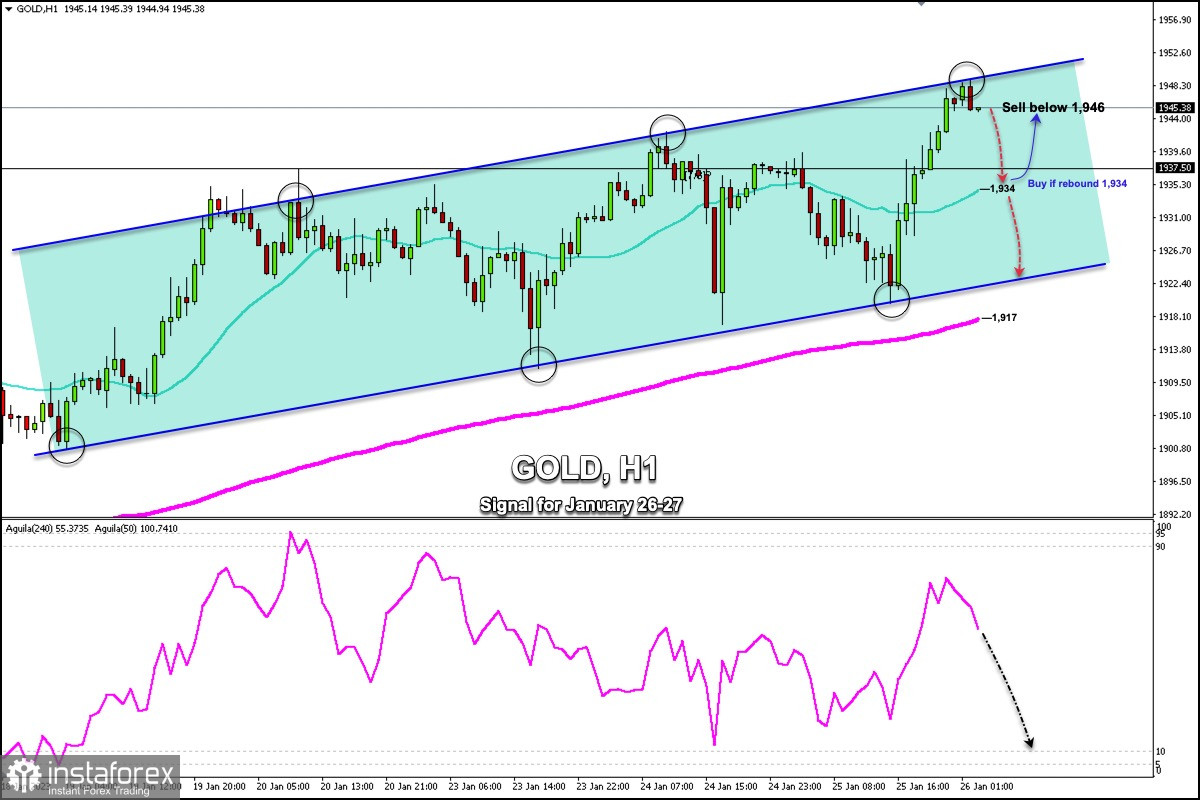
In the European session, XAU/USD reached 1,949.03, the highest level since April 2022. On the 1-hour chart, we can see that this level coincides with the top of the bullish channel formed since January 19.
In view of the fact that gold reached this resistance zone around the psychological level of 1,950, we could expect a technical correction in the next few hours and the price could even reach the 21 SMA located at 1,934. This zone has become a strong support for gold.
In case XAU/USD trades above 1,934 or above 7/8 Murray located at 1,937, the bullish cycle could resume and the metal could reach 1,945 and 1,956 (daily resistance).
The daily pivot point is around 1,938. We would expect that if gold consolidates below this level, the price will decline to reach support levels at 1,919 and 1,902.
The US dollar index (USDX) is showing signs of recovery which could put pressure on gold. However, this intraday rally will remain limited due to expectations of less aggressive monetary tightening by the Federal Reserve.
US yields are inversely correlated with gold. Looking at the chart, we see that these are unable to confirm a clear direction. Yields of 10-year benchmark Treasuries are hovering around 3.47% and the 2-year yield is around 4.11%. The lack of direction in yields contributed to XAU/USD trading in a range.
A firm consolidation above 1,938 should open the door to a bullish extension. In case gold continues trading above 1,950, it could hit the weekly resistance at 1,984 and ultimately at 8/8 Murray around the psychological level of $2,000. The corrections are limited, which suggests that the upside potential remains valid.
With a firm break below 1,935 (21 SMA), the next target will be in the 1,927 area. The next support is located at 1,923, coinciding with the bottom of the bullish channel. In case of a break of the bullish channel, we could expect the instrument to reach the 200 EMA located at 1,917. Finally, it could fall to the psychological level of 1,900.


