


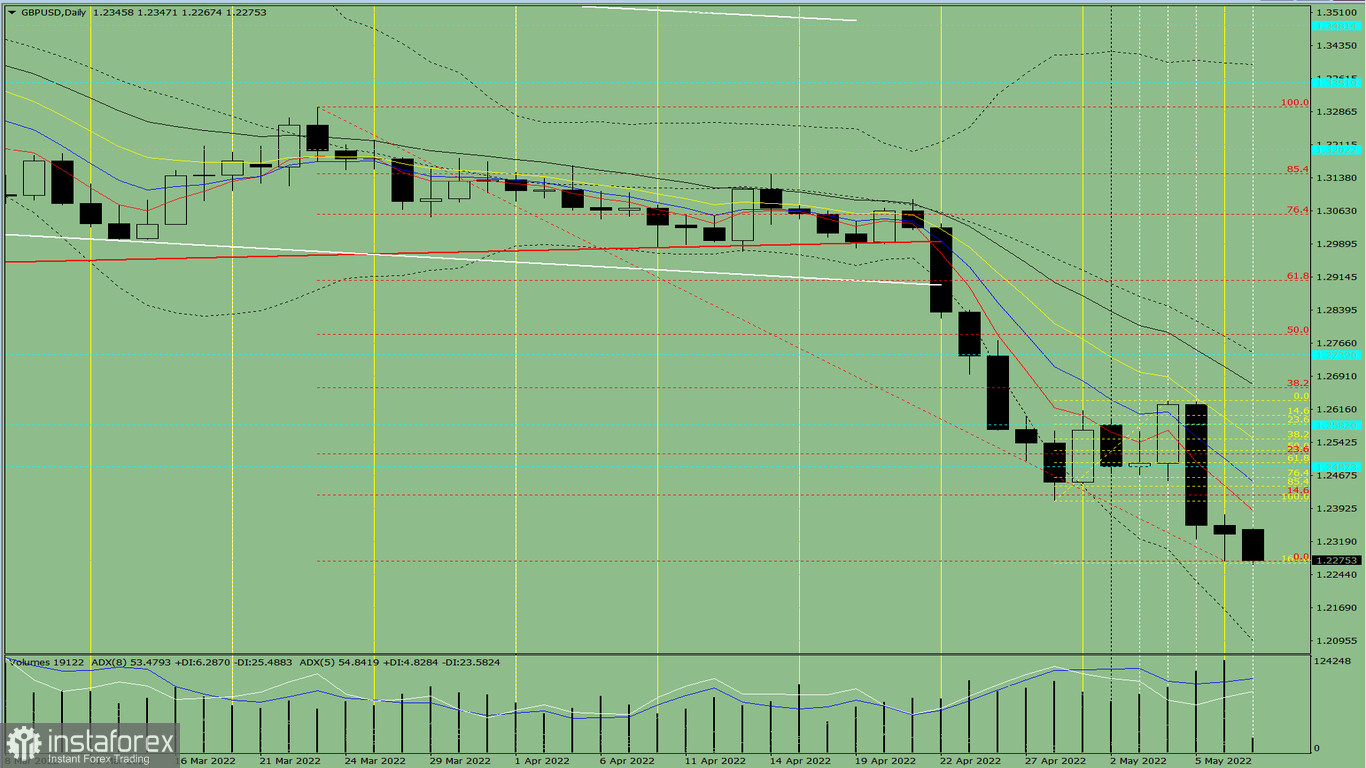
On Monday, from the closing price on Friday at 1.2336, GBP/USD could extend its down move with the target at 1.2097, the lower border of the Bollinger bands plotted by the black dotted line. After this target is hit, the price will aim for another target at 1.2465 that is the 14.6% retracement level plotted by the red line. After this level is tested, the price could aim for 1.2552, the 23.6% Fibonacci level plotted by the red dotted line.
Picture 1: trend analysis
Complex analysis
Indicator analysis – downFibonacci levels – downTrade volume – downCandlestick analysis – downTrend-following analysis – downBollinger bands – downWeekly chart – down
Conclusion
On Monday, from the closing price on Friday at 1.2336, GBP/USD could extend its down move with the target at 1.2097, the lower border of the Bollinger bands plotted by the black dotted line. After this target is hit, the price will aim for another target at 1.2465 that is the 14.6% retracement level plotted by the red line. After this level is tested, the price could aim for 1.2552, the 23.6% Fibonacci level plotted by the red dotted line.
Alternative scenario. From the closing price of the Friday's candlestick at 1.2336, the currency pair could extend its down move with the target at 1.2275, the lower fractal plotted by the red dotted line. From that level, GBP/USD could move upwards with the target at 1.2465 that matches the 14.6% retracement level plotted by the red plotted line.


