


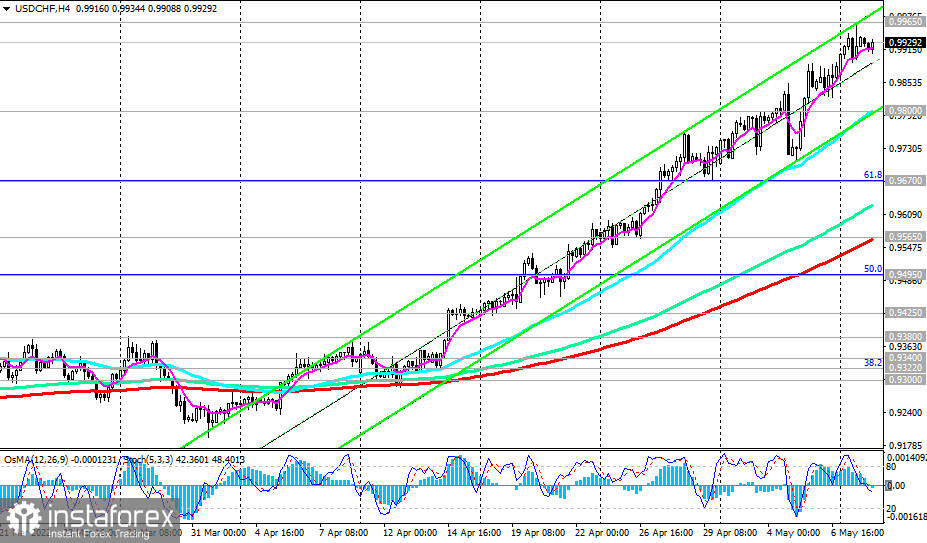
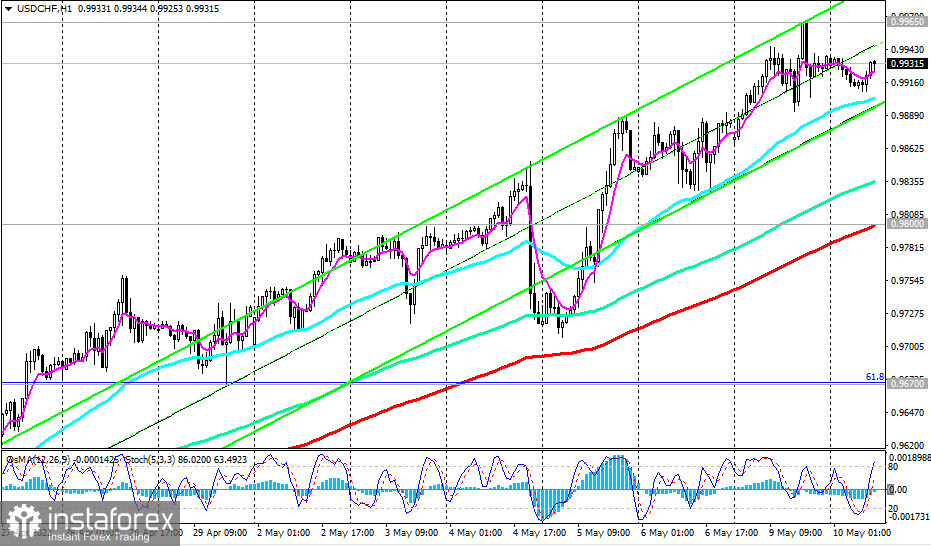
The USD/CHF currency pair is trading near 0.9940 as of this writing, down from yesterday's and a 29-month high of 0.9965.
A strong upward impulse prevails, which is provided primarily by the continued strengthening of the dollar.
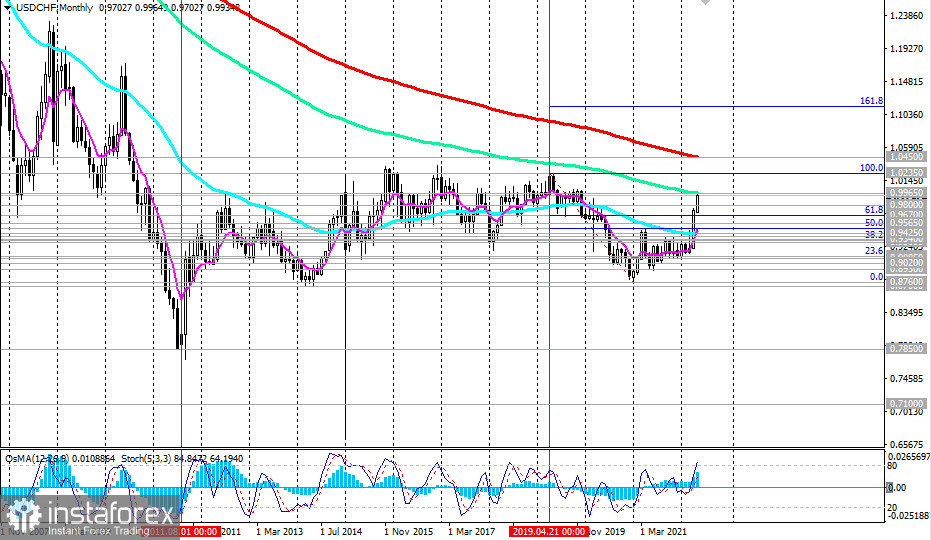
However, from a technical point of view, near the resistance level of 0.9965 (144 EMA on the monthly chart), either a rebound or a short-term downward correction is possible, especially if the dollar receives negative macro statistics from the US.
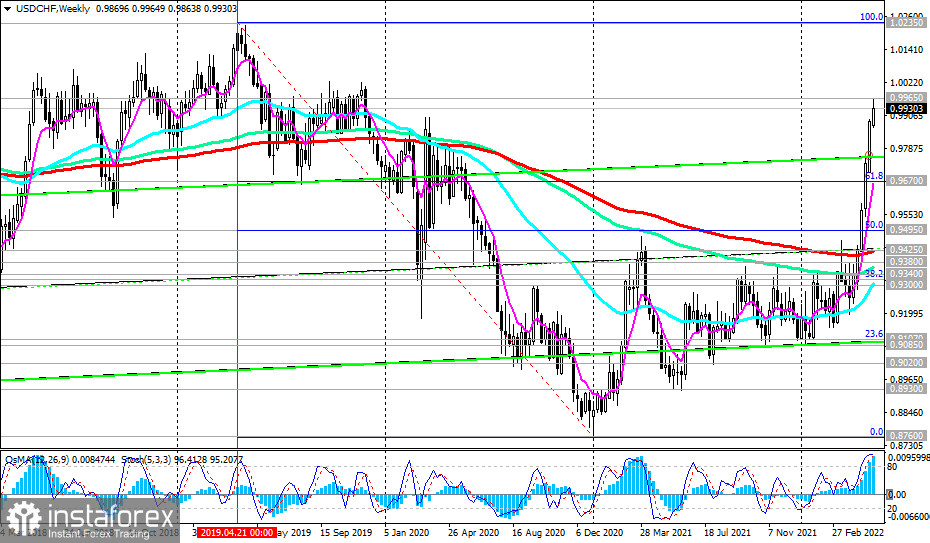
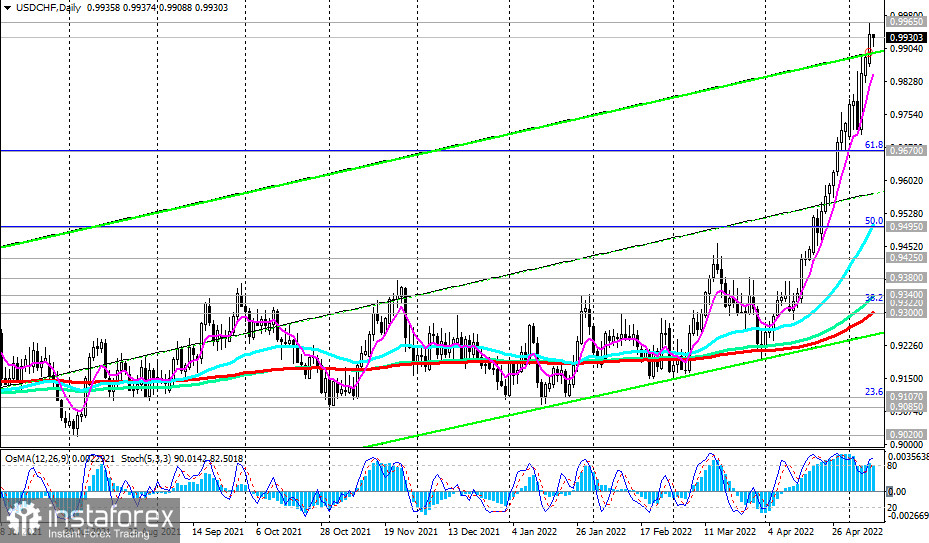
Such a correction is possible with the target near the important short-term support level 0.9800 (200 EMA on the 1-hour chart). A deeper correction, from a technical point of view, is possible up to the support levels of 0.9670 (61.8% Fibonacci retracement of the upward correction to the downward wave that began in April 2019 near 1.0235), 0.9565 (200 EMA on the 4-hour chart). A breakdown of the support level of 0.9300 (200 EMA on the daily chart) will return USD/CHF to the bearish market zone.
In the case of continued growth and after the breakdown of the resistance level of 0.9965, USD/CHF will head towards the resistance level of 1.0235 (local top and the Fibonacci level of 100%).
The breakdown of the resistance level of 1.0450 (200 EMA on the monthly chart) will finally bring the USD/CHF into the zone of a long-term bull market.
Support levels: 0.9900, 0.9800, 0.9700, 0.9670, 0.9600, 0.9565, 0.9500, 0.9495, 0.9425, 0.9380, 0.9322, 0.9300
Resistance levels: 0.9965, 1.0000, 1.0235, 1.0450
Trading Tips
Sell Stop 0.9890. Stop-Loss 0.9970. Take-Profit 0.9800, 0.9700, 0.9670, 0.9600, 0.9565, 0.9500, 0.9495, 0.9425, 0.9380, 0.9322, 0.9300
Buy Stop 0.9970. Stop-Loss 0.9890. Take-Profit 1.0000, 1.0100, 1.0235, 1.0300, 1.0450


