


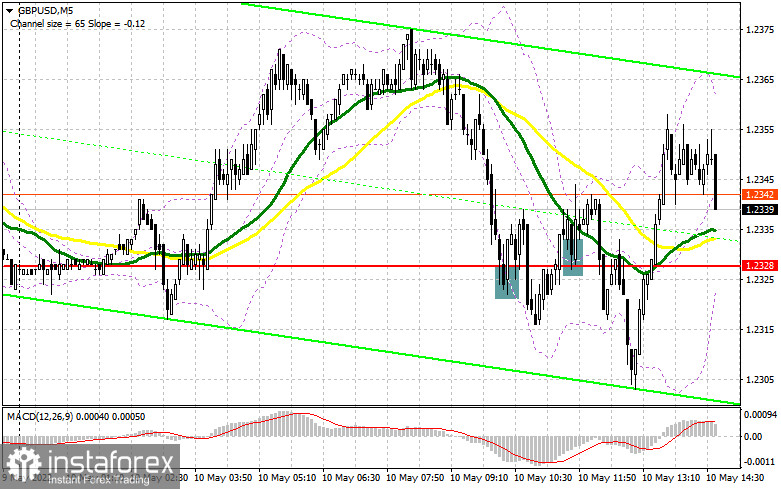
In my morning forecast, I paid attention to the level of 1.2328 and recommended making decisions on entering the market. Let's look at the 5-minute chart and figure out what happened. The formation of a false breakdown at this level in the first half of the day led to an excellent buy signal, but it never came to its realization. After moving up by 10 points, the pressure on the pair returned. The repeated formation of a false breakdown at 1.2328 a little later also did not give the desired result and a powerful rebound of the pound up. The breakout and the reverse test of 1.2328 - all this formed a sell signal, which eventually led to a fall of the pair by 30 points. And what were the entry points for the euro this morning?
To open long positions on GBP/USD, you need:
In the afternoon, the entire focus will shift to the speeches of representatives of the Federal Reserve System, as the data on the IBD economic optimism index are of little interest. Given that the technical picture has changed slightly, I advise you to focus on the nearest support of 1.2304. Hawkish statements by FOMC members may lead to a decline in the pound to the area of 1.2304, but only the formation of a false breakdown there will lead to a signal to open long positions in the expectation of continuing the upward correction and returning to 1.2372. Considering that trading takes place in the area of moving averages, it is difficult to say who will win in the end. It is possible to expect a sharper upward jerk only after the Fed representatives confirm the Fed's softer stance on monetary policy, which will weaken the dollar. Fixing above 1.2372 with a reverse test from top to bottom will lead to a buy signal followed by movement to the area of the highs: 1.2441 and 1.2505, where I recommend fixing the profits. In the case of a decline in the pound and the absence of buyers at 1.2304, most likely we will see an update of the annual lows and another sale in the area of 1.2261. I also advise you to enter the market there only if there is a false breakdown. You can buy GBP/USD immediately on a rebound from the minimum of 1.2185, or even lower - around 1.2122 and only to correct 30-35 points within a day.
To open short positions on GBP/USD, you need:
The fact that trading continues to be conducted in a side-channel play more into the hands of sellers, who needed a pause in the conditions of a large April movement of the pair down. If the pound jumps up after the speeches of the Fed representatives, only the formation of a false breakdown at 1.2372 will be a sell signal. You can also count on the breakdown of the 1.2304 level. A breakthrough and a reverse test from the bottom up of 1.2304 will lead to the formation of an additional sell signal that can collapse the pound to lows in the area of 1.2261, where I recommend fixing the profits. The 1.2185 area will be a more distant target, but it is possible to hope for the implementation of this scenario only after the speeches of the Fed representatives and their more hawkish statements. With the option of GBP/USD growth and lack of activity at 1.2372, a new upward jerk may occur against the background of the demolition of stop orders. In this case, I advise you to postpone short positions to a larger resistance of 1.2441. I also advise you to open short positions there only in case of a false breakdown. You can sell GBP/USD immediately for a rebound from 1.250
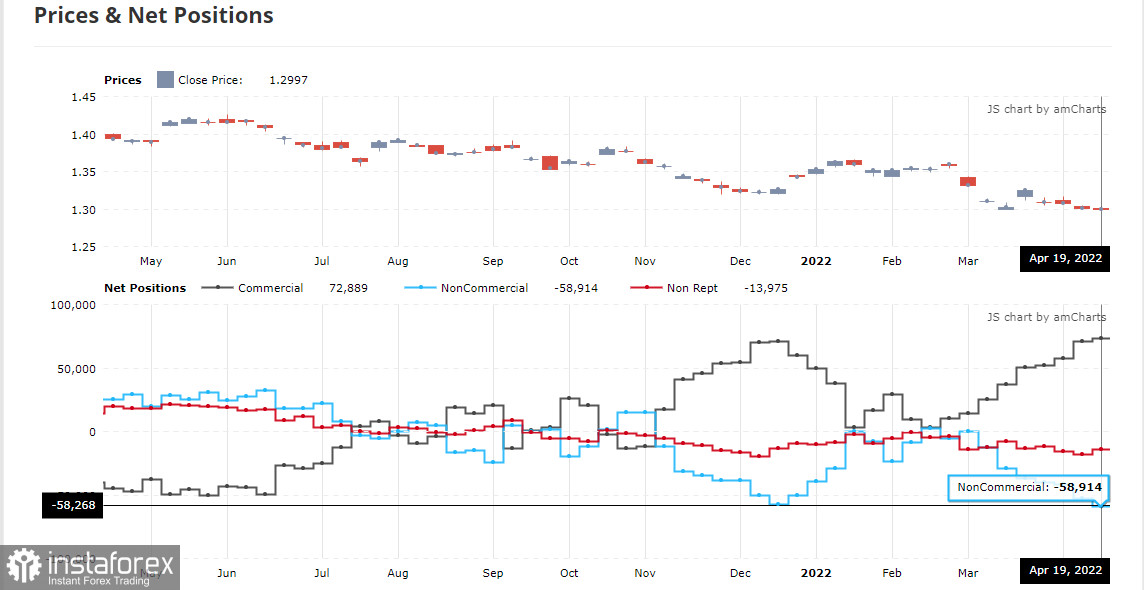
The COT report (Commitment of Traders) for April 19 recorded an increase in both short and long positions, but the former turned out to be much larger, which is obvious if you look at the GBP/USD chart. Things are very bad in the UK economy, which was confirmed last week by the Governor of the Bank of England, Andrew Bailey. His statements that the economy is heading towards recession were the last straw holding back the sellers of the pound in the second half of April. As a result, the breakdown of the finished minimum and a new major sale of the pound have already driven the trading instrument below the 26th figure and it seems that this is not the end. The growth of the consumer price index is steadily moving towards double-digit indicators, and the increasingly complicated situation in the world due to supply chain disruptions against the background of a new wave of COVID-19 in China creates even more problems. The situation will only worsen, as future inflation risks are now quite difficult to assess due to the difficult geopolitical situation, but the consumer price index will continue to grow in the coming months. The situation in the UK labor market, where employers are forced to fight for every employee by offering higher and higher wages, is also pushing inflation higher and higher. The Bank of England's decision on interest rates could further weaken the pound's position if Governor Andrew Bailey decides not to take serious measures to combat inflationary pressures. The COT report for April 19 indicated that long non-profit positions rose from the level of 35,514 to the level of 36,811, while short non-profit positions jumped from the level of 88,568 to the level of 95,727. This led to an increase in the negative value of the non-commercial net position from -53 054 to -58 268. The weekly closing price decreased from 1.3022 to 1.2997.
Signals of indicators:
Moving averages
Trading is conducted around 30 and 50 daily moving averages, which indicates market uncertainty with a further direction.
Note: The period and prices of moving averages are considered by the author on the hourly chart H1 and differ from the general definition of the classic daily moving averages on the daily chart D1.
Bollinger Bands
In the case of a decline, the lower limit of the indicator in the area of 1.2304 will act as support.
Description of indicators
- Moving average (moving average determines the current trend by smoothing out volatility and noise). Period 50. The graph is marked in yellow.
- Moving average (moving average determines the current trend by smoothing out volatility and noise). Period 30. The graph is marked in green.
- MACD indicator (Moving Average Convergence / Divergence - moving average convergence/divergence) Fast EMA period 12. Slow EMA period 26. SMA period 9
- Bollinger Bands (Bollinger Bands). Period 20
- Non-profit speculative traders, such as individual traders, hedge funds, and large institutions use the futures market for speculative purposes and to meet certain requirements.
- Long non-commercial positions represent the total long open position of non-commercial traders.
- Short non-commercial positions represent the total short open position of non-commercial traders.
- Total non-commercial net position is the difference between the short and long positions of non-commercial traders.


